
Welcome to the 2026 OSSRA Report
The “Open Source Security and Risk Analysis” (OSSRA) report has been the industry’s definitive look at the state of open source code for a decade. Each year, we analyze anonymized findings from commercial codebases audited by the Black Duck Audit Services team, and this provides an unmatched, real-world view of how open source is used—and sometimes misused—across every major industry. This year’s findings document a pivotal moment: The explosion of AI-assisted development has fundamentally altered the risk landscape for software and the baseline for compliance with new regulatory initiatives such as the EU Cyber Resilience Act (CRA) and the Digital Operational Resilience Act (DORA).
The Way Software Is Written Has Changed
The mean number of open source vulnerabilities per codebase has more than doubled. License conflicts have surged to their highest levels in OSSRA history, driven largely by the proliferation of third-party dependencies. And the average codebase now contains over 84,000 files—a figure that has quadrupled in just five years.
The urgency of these findings is underscored by real-world attack data: 65% of the organizations Black Duck surveyed in 2025 reported experiencing a software supply chain attack in the past year. These are active threats impacting enterprises across every industry.
The traditional approach to application security was designed for a world where humans wrote code at human speed. Today, AI-generated code is using open source at unprecedented scale, compounding the rate of software development, and AppSec teams are struggling to keep pace. AI coding assistants—tools like GitHub Copilot, Cursor, Claude Code, and Windsurf—are now as fundamental to the developer’s toolkit as a compiler or a debugger. According to Black Duck’s research, 67% of organizations are already using AI-powered coding assistants. And 71% of companies that prohibit their developers from using AI coding assistants acknowledge that they’re being used anyway, against corporate policies.
AI coding assistants have become as fundamental to the developer’s toolkit as a compiler or a debugger.
The challenges outlined in this report are not caused by AI coding tools themselves, but by the scale and speed they enable. Detecting its use within your supply chain is an evolving challenge facing every organization. Just as open source transformed software development—and is now a permanent fixture in how software is built—AI-assisted coding is here to stay.
This report provides the data you need to understand what’s happening in the open source landscape and how it affects your security, legal, and operational risk posture. Our goal is to give you the insights to make informed decisions in an environment that continues to evolve.
The Expanding Attack Surface
The number of files per codebase is up 74% year-over-year. Components per application have increased 30%. And the volume of disclosed vulnerabilities continues to accelerate, driven by factors such as the Linux Kernel team’s 2024 decision to become a CVE Numbering Authority—a single change that added thousands of new CVE assignments to kernel-related code.
The result is that security teams face more findings to evaluate, prioritize, and remediate than ever before. This is a reality of application security, not a failing of security tools. The question organizations must answer is whether their security approach has the precision to separate genuine risk from background noise—and whether their security tools provide the intelligence needed to guide remediation decisions.
Organizations relying on surface-level scanning of software—whether from legacy tools or newer AI-only solutions—face a structural disadvantage. This year’s data reveals that audited codebases contain 581 vulnerabilities on average. Clearly, you need more than a list of findings. You need context: exploitability data, remediation guidance, coverage beyond CVE databases, and the ability to detect open source that entered your codebase outside of package managers.
The sections that follow examine what this year’s data reveals across three dimensions of risk: security vulnerabilities, license compliance, and the impact of software obsolescence, also known as operational sustainability. We then discuss how organizations can address these challenges using both established approaches and emerging capabilities.
The question organizations must answer is whether their security approach has the precision to separate genuine risk from background noise—and whether their security tools provide the intelligence needed to guide remediation decisions.
About This Year’s Data
The findings in this report are derived from the anonymized data produced by Black Duck Audit Services while auditing commercial and proprietary codebases for M&A transactions, regulatory compliance, and internal risk assessment.
The Black Duck Audit team evaluates and presents audit data by splitting single-customer codebases into multiple analyses, termed “projects.” This technique provides a more granular approach to analyzing increasingly larger customer codebases and presents highly accurate component identification and dependency tracking. While we still refer to customers’ overall “codebases” in the OSSRA, at a more granular level, the 947 codebases submitted to Black Duck between November 2024 and October 2025 entail the analysis of nearly 3,000 individual projects.
| Metric | Value |
|---|---|
| Codebases scanned | 947 |
| Individual projects analyzed | 2,843 |
| M&A transactions represented | 197 |
| Maximum number of projects associated with a single codebase | 50 |
Methodology
Black Duck audits employ multiple detection methods to create a comprehensive inventory of open source components.
- Dependency analysis examines package managers and manifest files
- Snippet analysis identifies code fragments that match known open source
- Binary analysis investigates compiled code where source is unavailable
- CodePrint analysis matches files against the Black Duck KnowledgeBase™
This multifactor approach is essential for accuracy. Relying solely on declared dependencies—what appears in a package.json or pom.xml—misses a significant portion of the open source present in a codebase, including vendor code, copy-pasted snippets, and transitive dependencies.
Industry Coverage
The codebases in this year’s analysis span 17 industries, with Enterprise Software/SaaS representing the largest segment at 415 codebases. Notably, Energy and Clean Tech doubled its representation from last year’s report, while Healthcare, Health Tech, and Life Sciences saw a significant decline—shifts that reflect broader M&A activity patterns in these sectors.
The Black Duck KnowledgeBase
All findings are matched against the Black Duck KnowledgeBase, the most comprehensive and battle-tested repository of open source intelligence in the world. This foundation is what enables Black Duck to deliver verified analysis, exploitability data, and remediation guidance that other tools—including AI-only solutions—can only guess at.
3.2 petabytes
of open source software metadata and archives
10+ million
open source projects from 58,000+ data sources
317,000
known vulnerabilities
63,000
Black Duck Security Advisories delivering vulnerability intelligence
3,000
licenses tracked
Data Collection Period
The findings in this report are based on audits conducted between November 2024 and October 2025, providing the most current view of open source usage and risk available. The following sections present detailed findings from this year’s analysis, beginning with key metrics on open source adoption and codebase complexity. We then examine the three dimensions of open source risk in depth: security vulnerabilities, license compliance, and operational sustainability. Our closing section discusses how organizations can address these challenges using Black Duck’s portfolio of application security solutions.
Key Findings
Open source adoption continues to accelerate, and the scale and complexity of open source—along with the risks that accompany it—are growing across every dimension we measure.
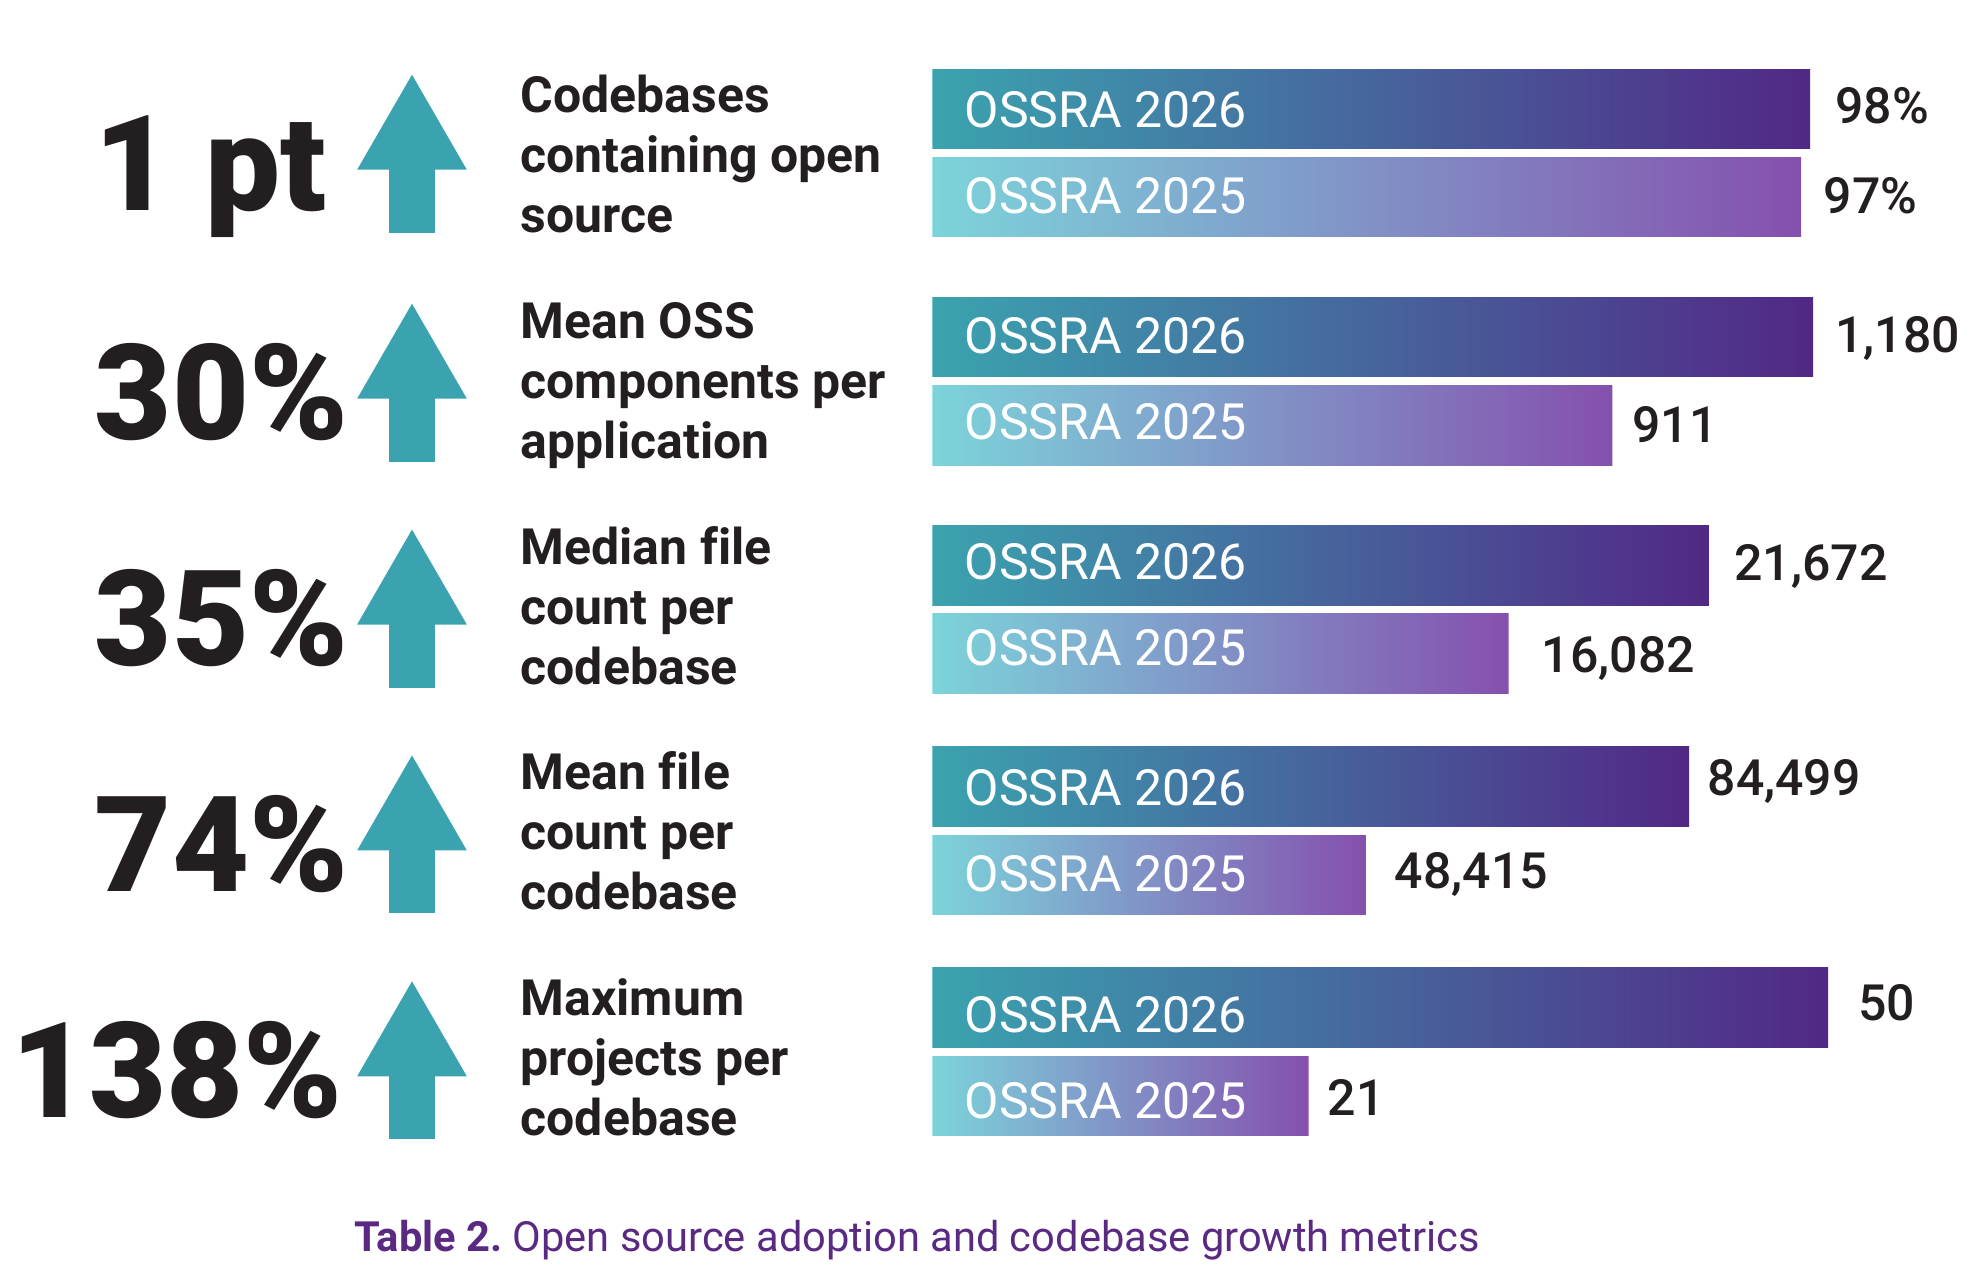
View underlying data — Table 2. Open source adoption and codebase growth metrics
| Metric | OSSRA 2026 | OSSRA 2025 | Change |
|---|---|---|---|
| Codebases containing open source | 98% | 97% | +1 pt |
| Mean OSS components per application | 1,180 | 911 | +30% |
| Median file count per codebase | 21,672 | 16,082 | +35% |
| Mean file count per codebase | 84,499 | 48,415 | +74% |
| Maximum projects per codebase | 50 | 21 | +138% |
As shown in Table 2, open source is now effectively universal in commercial software. Only 2% of the codebases we audited contained no open source components—and even that figure likely represents specialized legacy systems rather than new development. For practical purposes, if you’re building software today, you’re building with open source.
Every organization is now dependent on the security practices of thousands of open source maintainers, the licensing decisions made for open source projects, and the continued viability of those projects’ components. The need for robust supply chain security is the reality of modern software development.
Codebase Complexity Over Time
The median codebase file count has grown from 16,082 to 21,672 in just one year, a 35% increase that reflects the ongoing growth in application complexity driven by microservices architectures, AI/ML dependencies, and AI-assisted development velocity.
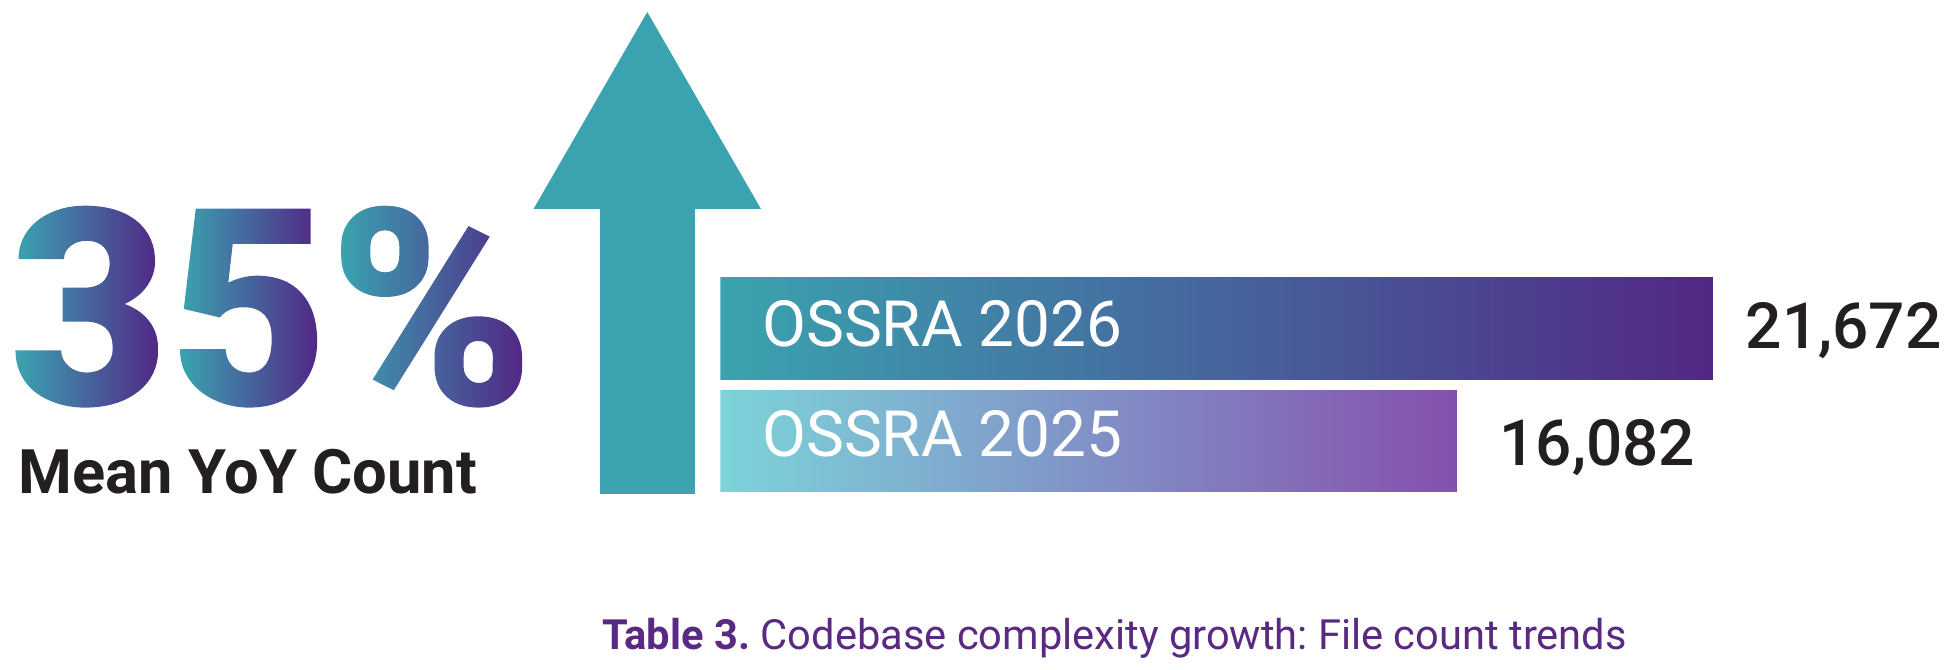
View underlying data — Table 3. Codebase complexity growth: File count trends
| Report | Median File Count |
|---|---|
| OSSRA 2026 | 21,672 |
| OSSRA 2025 | 16,082 |
| Mean YoY Count: +35% | |
While likely only one of several factors, the timing of the file count growth corresponds with the mainstream adoption of AI coding assistants. GitHub Copilot reached general availability in June 2022; by late 2023, it and its competitors had become standard tools for millions of developers.
How We Identify Open Source
| Method | Share | Techniques |
|---|---|---|
| Automated | 84% | Package manager analysis, manifest file scanning |
| Deep analysis | 16% | Snippet matching, binary analysis, manual review |
In our audits, 84% of open source components were identified through automated detection methods—package manager analysis and manifest file scanning. This reflects the maturity of the package management ecosystems in the codebases we examined.
But the 16% requiring deeper analysis tells an important story. This code entered the codebase outside of standard package management, through vendor dependencies copied directly into repositories, code snippets pulled from Stack Overflow or generated by AI assistants, or binary components included without source. These components are invisible to tools that rely solely on manifest files.
Organizations that depend only on dependency-manifest scanning are missing nearly one in six open source components in their codebases. In a world where a single unpatched vulnerability can lead to breach, that oversight is unacceptable.
Security Risk: Vulnerabilities
If there’s one finding that defines the 2026 OSSRA, it’s this: Mean vulnerabilities per codebase have more than doubled. This section examines the vulnerability landscape in depth: what’s driving the increase, where the greatest concentrations of risk lie, and the emerging threat vectors that organizations must address.
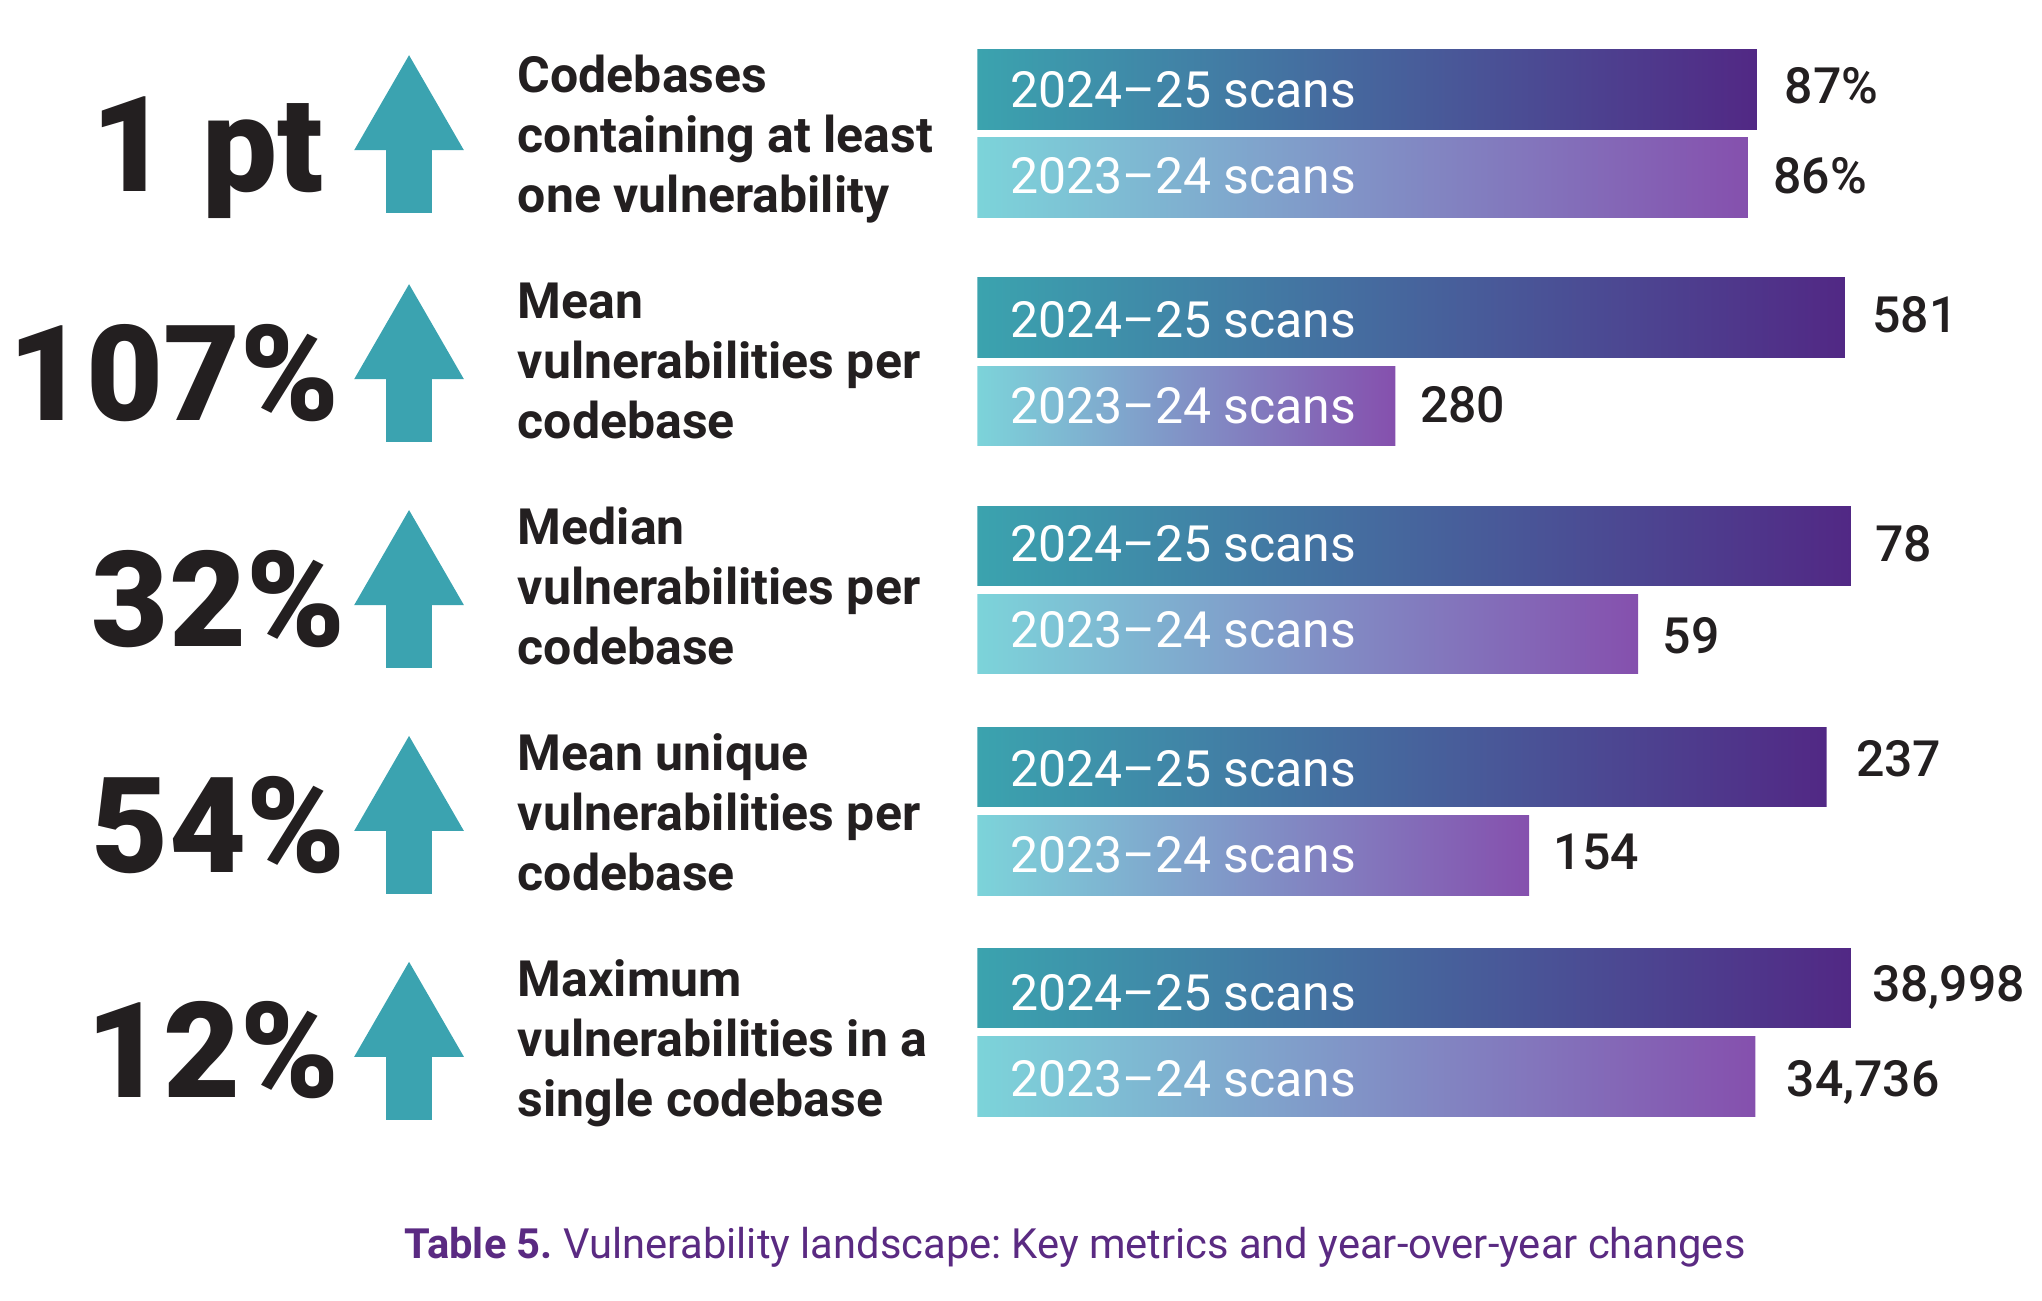
View underlying data — Table 5. Vulnerability landscape: Key metrics and year-over-year changes
| Metric | 2024–25 Scans | 2023–24 Scans | Change |
|---|---|---|---|
| Codebases containing at least one vulnerability | 87% | 86% | +1 pt |
| Mean vulnerabilities per codebase | 581 | 280 | +107% |
| Median vulnerabilities per codebase | 78 | 59 | +32% |
| Mean unique vulnerabilities per codebase | 237 | 154 | +54% |
| Maximum vulnerabilities in a single codebase | 38,998 | 34,736 | +12% |
As shown in Table 5, the distinction between total vulnerabilities (581 mean) and unique vulnerabilities (237 mean) matters. Total vulnerabilities count every instance—if a vulnerable version of jQuery appears in 10 different places in your codebase, that’s 10 vulnerabilities. Unique vulnerabilities count distinct CVEs. Both metrics are up dramatically, but the total count reflects the growing problem of duplicated dependencies across complex applications.
The gap between mean (581) and median (78) reveals the distribution. Most codebases have dozens to hundreds of vulnerabilities. But the long tail extends to nearly 39,000 vulnerabilities in a single codebase—an outlier that nonetheless represents a real application that a real organization is running in production.
Understanding the Drivers
The doubling of mean vulnerabilities reflects multiple converging factors rather than a single cause.
Component growth. With 30% more components per codebase year-over-year (911 → 1,180), the aggregate vulnerability count increases in turn. Each component carries its own vulnerability history. More dependencies mean more code, and more code means more potential vulnerabilities.
Component selection patterns. AI coding assistants tend to suggest popular, well-established libraries—the components that appear most frequently in their training data. These libraries, precisely because they’re widely used and heavily scrutinized, often have longer vulnerability histories.
Development velocity. AI-assisted development accelerates the rate at which new dependencies enter codebases, compounding the effects noted above.
Disclosure acceleration. The security research community’s capacity to find and disclose vulnerabilities continues to grow. Notably, the Linux Kernel team became a CVE Numbering Authority (CNA) in early 2024, resulting in a dramatic increase in kernel-related CVE assignments—from 290 in 2023 to over 3,500 in 2024. For any codebase with Linux Kernel dependencies, this single change added hundreds of vulnerabilities to the count without any change to the underlying code. As an example, in the OSSRA 2024–25 timeframe, over 5,000 Linux Kernel vulnerabilities were identified.
The vulnerability explosion is real, but its causes are multifaceted. Organizations shouldn’t assume that addressing any single factor—whether AI governance, dependency hygiene, or update practices—will solve the problem in isolation.
The BDSA Advantage
The counts in Table 6 reflect Black Duck’s comprehensive open source vulnerability reporting, which extends beyond public CVE databases, and provides much faster analysis than NVD reporting capabilities.
| BDSA coverage metric (Nov 2024–Oct 2025) | Count |
|---|---|
| New BDSAs added | 20,520 |
| BDSAs with analyzed CVE | 7,187 |
| BDSAs with no analyzed NVD CVE | 13,333 |
BDSA coverage. During November 2024 to October 2025, the NVD had yet to analyze 4,301 CVEs that have Black Duck Security Advisory (BDSA) coverage. An additional 133 BDSAs had no CVEs. And 8,899 BDSAs cover malware packages that CVE does not cover.
BDSA speed. Of the CVEs analyzed during this timeframe, Black Duck was, on average, 100 days faster, and on average, 94 days faster for critical- and high-risk vulnerabilities.
Malware. Most malicious packages don’t receive CVEs, but ensuring visibility into them is still critical as malware represents an active threat to software. Black Duck creates BDSAs to track and report on these packages where they are found, providing customers with visibility into supply chain attacks that would otherwise go undetected.
Continuous expansion. The addition of 20,520 BDSAs in the past year—an average of 56 per day—reflects both the accelerating pace of open source vulnerability disclosure and Black Duck’s commitment to comprehensive coverage.
High-Risk Vulnerabilities
Not all vulnerabilities are created equal. Table 7 categorizes findings by severity.
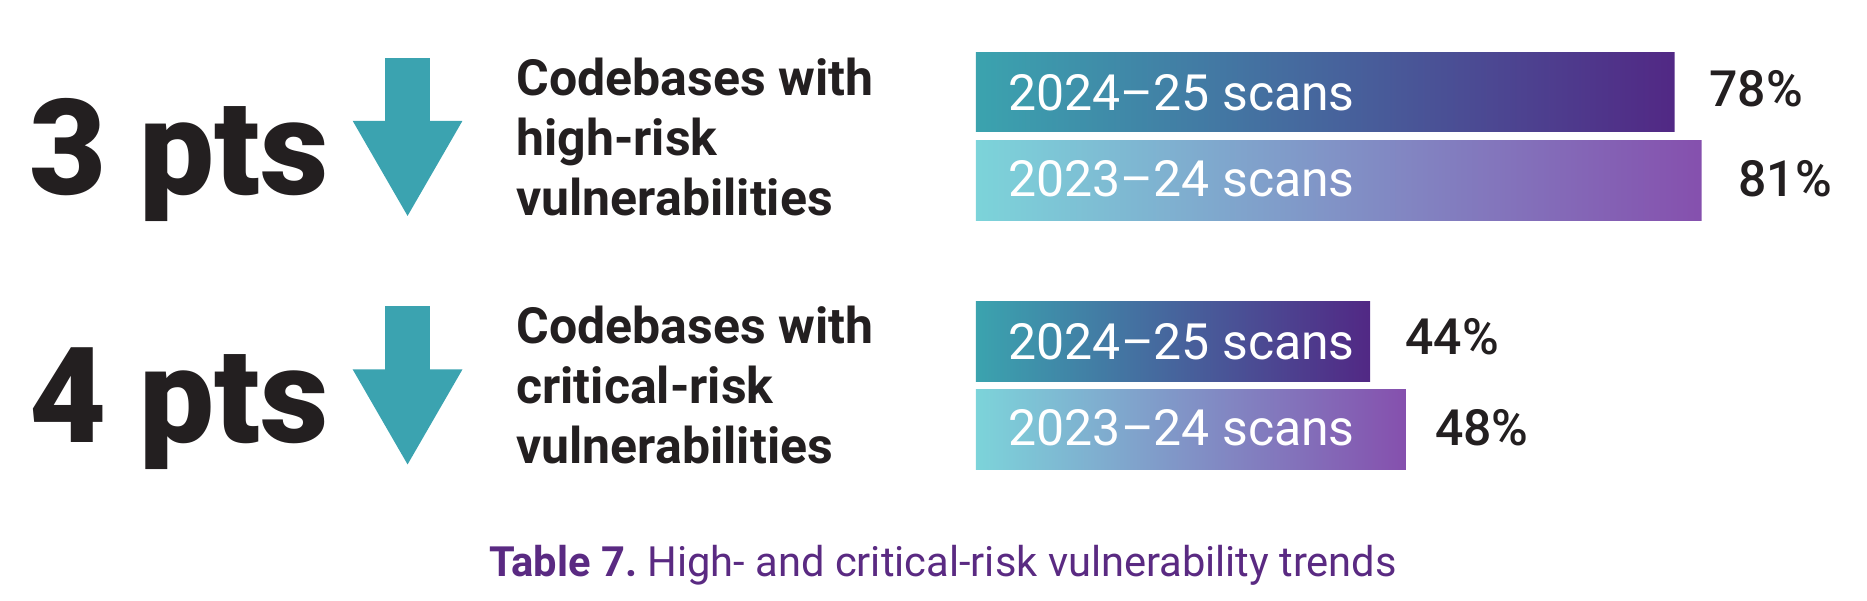
View underlying data — Table 7. High- and critical-risk vulnerability trends
| Metric | 2024–25 Scans | 2023–24 Scans | Change |
|---|---|---|---|
| Codebases with high-risk vulnerabilities | 78% | 81% | −3 pts |
| Codebases with critical-risk vulnerabilities | 44% | 48% | −4 pts |
The modest decline in high- and critical-risk vulnerability prevalence is one of the few positive signals in this year’s data. It suggests that organizations are prioritizing—and successfully remediating—the most severe issues, even as overall vulnerability counts rise.
However, the numbers remain concerning. More than three-quarters of codebases contain at least one high-risk vulnerability, and nearly half contain critical-risk vulnerabilities. These are issues where exploitation could result in significant data breaches, system compromises, or operational disruptions.
Top Vulnerabilities in 2025
The most frequently occurring vulnerabilities across audited codebases are shown in Table 8.
| Rank | CVE/BDSA | Unique count | Total count | Percentage of codebases |
|---|---|---|---|---|
| 1 | BDSA-2021-3651 | 998 | 3,097 | 35% |
| 2 | BDSA-2025-2047 (CVE-2025-27789) | 870 | 961 | 21% |
| 3 | CVE-2022-25883 | 798 | 841 | 21% |
| 4 | BDSA-2020-0964 (CVE-2020-11023) | 791 | 2,594 | 28% |
| 5 | BDSA-2020-0686 (CVE-2020-11022) | 788 | 2,588 | 28% |
| 6 | BDSA-2019-1138 (CVE-2019-11358) | 745 | 2,415 | 27% |
| 7 | BDSA-2014-0063 | 672 | 2,179 | 25% |
| 8 | BDSA-2017-2930 (CVE-2015-9251) | 651 | 2,135 | 25% |
| 9 | BDSA-2024-3717 (CVE-2024-37890) | 632 | 721 | 21% |
| 10 | BDSA-2015-0567 | 571 | 1,841 | 23% |
Notable finding: BDSA-2025-2047 (CVE-2025-27789) is a new entry in 2025, appearing in over 20% of codebases within its first year of disclosure. This rapid propagation illustrates how quickly new vulnerabilities can spread across the software ecosystem.
jQuery-related vulnerabilities (CVE-2020-11022, CVE-2020-11023, CVE-2019-11358, CVE-2015-9251) continue to dominate, collectively affecting 25%–28% of codebases. These vulnerabilities are years old, with patches long available—yet they persist across a significant portion of commercial software.
Supply Chain Attacks: 2025 in Review
The urgency of our vulnerability findings is underscored by real-world attack data: 65% of the organizations Black Duck surveyed in 2025 reported experiencing a software supply chain attack in the past year.
Of the malicious packages identified by Black Duck across open source ecosystems:
- Sixty-six percent were malicious packages created specifically to harm users through typosquatting, dependency confusion, or social engineering
- Thirty-four percent were hijacked—legitimate packages compromised after gaining community trust, often through maintainer account takeover or malicious commits
The hijacked category is particularly dangerous. These packages have established usage, positive reputation, and existing installations. When compromised, the blast radius has the potential to extend to every application that depends on them.
65% of organizations reported experiencing a software supply chain attack in the past year—these are active threats impacting enterprises across every industry.
The npm Siege: September 2025
In September 2025, the JavaScript ecosystem experienced the most sophisticated and coordinated supply chain attack in its history. Multiple concurrent campaigns—including PhantomRaven and Shai-Hulud—demonstrated that the trust model of the npm registry, which serves over 2.6 billion downloads weekly, could be weaponized at scale.
The PhantomRaven campaign, identified in late August and peaking in September, was distinct for its technical evasion capabilities. Unlike previous attacks that relied on simple typosquatting, PhantomRaven targeted the mechanism of dependency resolution itself.
PhantomRaven packages appeared largely benign upon static inspection. The malicious payload was introduced only during the installation process—attackers utilized scripts to fetch malicious code from external, attacker-controlled infrastructure.
Shai-Hulud: The Self-Propagating Worm
The Shai-Hulud campaign marked a major escalation in supply chain attacks by introducing true self-propagation. After a targeted MFA-phishing campaign allowed attackers to take over maintainer accounts from projects such as Postman, PostHog, and AsyncAPI, malicious scripts were injected into compromised packages and pushed as new releases. Once installed, the malware harvested sensitive credentials—including Git and GitHub tokens, environment variables, npm tokens, and API keys—and automatically used stolen npm credentials to publish trojanized updates to any other packages maintained by the victim. This enabled rapid, automated spread across the ecosystem.
The initial wave compromised over 500 packages, with thousands of credentials likely exposed before npm removed malicious versions. A second wave, Shai-Hulud 2.0, emerged in November 2025, using a more aggressive payload that executed during npm install, before installation completed (even if installation subsequently failed), and added destructive behavior such as wiping the user’s home directory when no credentials were found. This variant compromised nearly 800 packages, created more than 25,000 GitHub repositories containing stolen secrets, and leaked over 400,000 credentials, significantly amplifying the blast radius before removal.
React2Shell: Architectural Complexity as Attack Vector (CVE-2025-55182)
While the npm attacks targeted the distribution of code, the React2Shell vulnerability (CVE-2025-55182) demonstrated a different category of supply chain risk: architectural complexity creating exploitable attack vectors in trusted frameworks.
Disclosed in December 2025, React2Shell was an unsafe deserialization vulnerability in React Server Components (RSC), specifically in the React Flight protocol used for server-client communication. The vulnerability allowed attackers to achieve remote code execution through a crafted HTTP POST request—no authentication required.
State-Sponsored Activity: Lazarus Group
Supply chain attacks aren’t limited to criminal actors seeking financial gain. The North Korean state-sponsored group Lazarus waged aggressive campaigns against the financial and cryptocurrency sectors throughout 2025.
Lazarus published over 100 malicious packages to npm and PyPI, often disguised as tools for managing cryptocurrency wallets or connecting to banking APIs. The group utilized typosquatting and combosquatting (combining popular package names) to trick developers.
The Implications
The 2025 supply chain attacks reveal several sobering realities.
- Trust is transitive—and fragile. The compromise of foundational packages like chalk and debug demonstrated that the security of every application developers build depends on the security practices of maintainers they’ve never heard of, managing projects they didn’t know they depended on.
- Complexity creates attack surface. React2Shell showed that even “secure-by-design” frameworks can harbor critical vulnerabilities in their architectural complexity. The more sophisticated the framework, the more potential for obscure edge cases that become exploitable.
- AI amplifies both attack and defense. Attackers used AI to generate plausible package names and identify vulnerabilities at scale. The same capabilities can aid defenders—but only if security tools evolve to match the threat.
AI Model Risk: An Emerging Attack Surface
AI and machine learning models are becoming the backbone of modern apps, with over 850,000 models hitting platforms like Hugging Face in 2024 alone. As organizations incorporate AI/ML models into their software—Black Duck research indicates that 49% now include open source AI/ML models in the software they ship—a new category of risk is emerging.
The Visibility Challenge
AI models present a unique governance challenge: They can be embedded in applications in ways that evade standard detection. Unlike traditional dependencies declared in manifest files, models may be:
- Deliberately obscured: Embedded deep within application source files
- Undeclared: Not listed in build manifests or dependency trees
- Modified from origin: Retrained or fine-tuned in ways that change their behavior and risk profile
Without visibility into what models exist in a codebase, organizations cannot assess their exposure. And that exposure is multidimensional.
Licensing Complexity
AI models carry licensing obligations that are often unclear or misunderstood. A model downloaded from Hugging Face or similar repositories may be governed by open source licenses, commercial licenses, or custom terms that restrict use cases, require attribution, or impose redistribution obligations.
The question of whether a model was simply consumed or significantly retrained has licensing implications. A retrained foundational model may carry different obligations than one used as-is. Organizations building policies around AI model usage—such as “no retrained foundational models” or “no models trained on undisclosed datasets”—need visibility into model provenance to enforce those policies.
Regulatory Pressure
The EU AI Act and similar emerging regulations such as South Korea’s new AI Basic Act are creating accountability requirements for AI systems. Organizations must be able to demonstrate:
- What models are present in their applications
- Where those models originated
- What data they were trained on
- How they’ve been modified
- Where is the model executed and are there data sovereignty questions
Customers, partners, and regulators increasingly expect transparency about AI components. Organizations that cannot provide it face both regulatory exposure and competitive disadvantage.
Supply Chain Transparency
Just as Software Bills of Materials (SBOMs) have become essential for tracking open source components, AI model transparency is becoming a requirement for supply chain governance. Organizations need the ability to:
- Identify models present in their codebases, even when not explicitly declared
- Understand model origins, capabilities, and training data
- Include model information in SBOMs to satisfy customer and industry requirements
- Apply consistent policies across AI model usage
What This Means for Security Teams
Our understanding of the risks associated with AI models—which include prompt injection vulnerabilities, data poisoning, adversarial inputs, and model supply chain attacks—is still maturing. The security research community is actively exploring these attack vectors, and the threat landscape will evolve rapidly over the coming years.
What’s clear today is that organizations need foundational visibility: You cannot secure what you cannot see. As AI models become as ubiquitous as open source libraries, the same governance discipline that applies to open source dependencies must extend to AI components.
Vulnerability Patterns by Industry
Vulnerability profiles vary significantly by industry, reflecting different technology stacks, regulatory environments, and development practices.
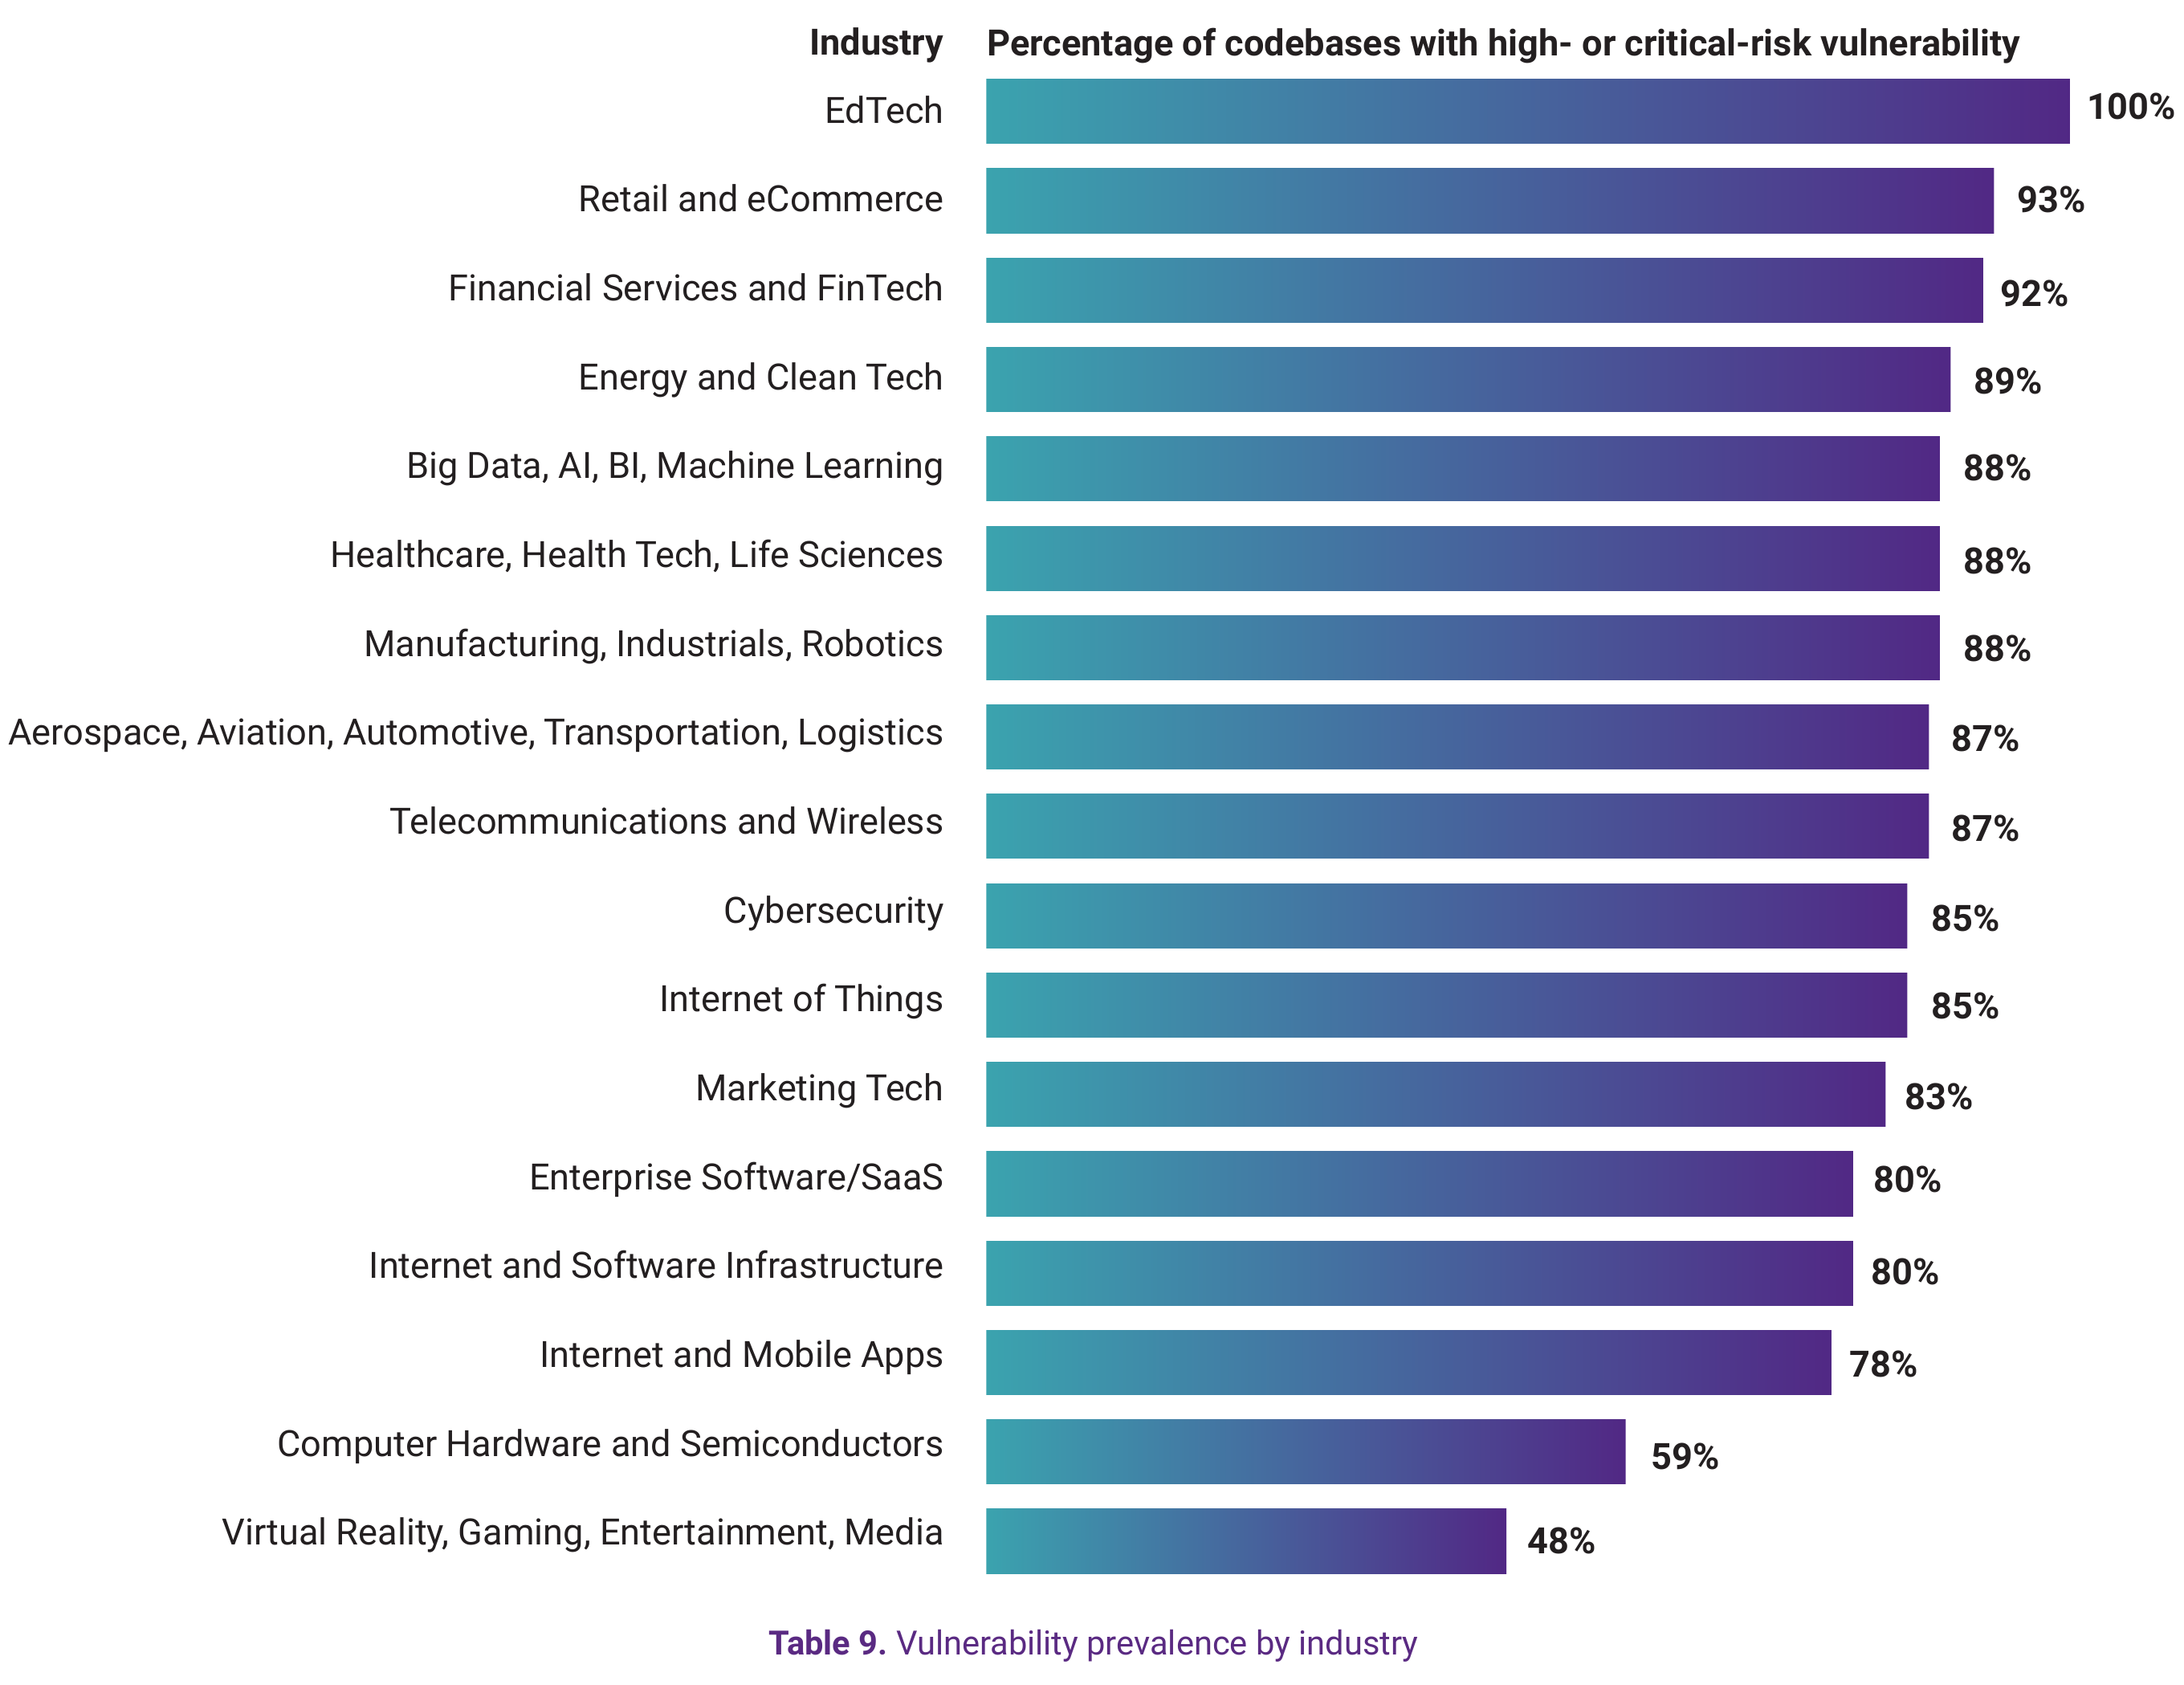
View underlying data — Table 9. Vulnerability prevalence by industry
| Industry | Percentage of codebases with high- or critical-risk vulnerability |
|---|---|
| EdTech | 100% |
| Retail and eCommerce | 93% |
| Financial Services and FinTech | 92% |
| Energy and Clean Tech | 89% |
| Big Data, AI, BI, Machine Learning | 88% |
| Healthcare, Health Tech, Life Sciences | 88% |
| Manufacturing, Industrials, Robotics | 88% |
| Aerospace, Aviation, Automotive, Transportation, Logistics | 87% |
| Telecommunications and Wireless | 87% |
| Cybersecurity | 85% |
| Internet of Things | 85% |
| Marketing Tech | 83% |
| Enterprise Software/SaaS | 80% |
| Internet and Software Infrastructure | 80% |
| Internet and Mobile Apps | 78% |
| Computer Hardware and Semiconductors | 59% |
| Virtual Reality, Gaming, Entertainment, Media | 48% |
The finding that 100% of audited EdTech codebases contained high- or critical-risk vulnerabilities is striking, though the result likely reflects resource constraints common in the education technology sector rather than inherently riskier technology choices.
Retail/eCommerce and Financial Services/FinTech applications show high vulnerability concentrations (93% and 92% respectively), reflecting large, complex codebases with extensive third-party integrations. Regulatory requirements in these sectors (such as PCI DSS in the Retail/eCommerce sector) often constrain update velocity—changes require extensive testing, documentation, and approval processes that can slow remediation. Though financial services regulations such as DORA increasingly require financial institutions to maintain detailed knowledge of their supply chains and minimize risks from unpatched vulnerabilities.
Healthcare, Health Tech, Life Sciences applications (88%) face similar regulatory constraints. HIPAA compliance adds overhead to every change, and the combination of complex integrations (EHRs, insurance systems, medical device APIs) and a highly cautious regulatory culture often slows updates or modernization efforts. That caution creates conditions in which outdated systems and unpatched vulnerabilities linger longer than they should.
At the other end of the spectrum, Computer Hardware/Semiconductors (59%) and VR/Gaming/Entertainment/Media (48%) show notably lower vulnerability rates. These sectors tend to have more controlled dependency selection, longer development cycles, and—in the case of hardware—significant amounts of proprietary code rather than open source dependencies.
Legal and IP Risk: Licensing
Open source licensing rarely generates the urgency that vulnerabilities command. Security incidents make headlines; license disputes settle quietly. But the legal and financial exposure from license noncompliance can exceed security breach costs—and unlike vulnerabilities, license obligations don’t expire. A GPL violation discovered during M&A due diligence can derail an acquisition. A license conflict surfaced by a competitor can trigger costly litigation. And in an era of AI-generated code with unknown provenance, license risk has become harder to assess than ever.
This section examines the licensing landscape revealed in our audit data: the largest year-over-year increase in license conflicts in OSSRA history, the drivers behind that increase, and the emerging challenge of AI-introduced license risk.
License Conflicts at Historic Highs
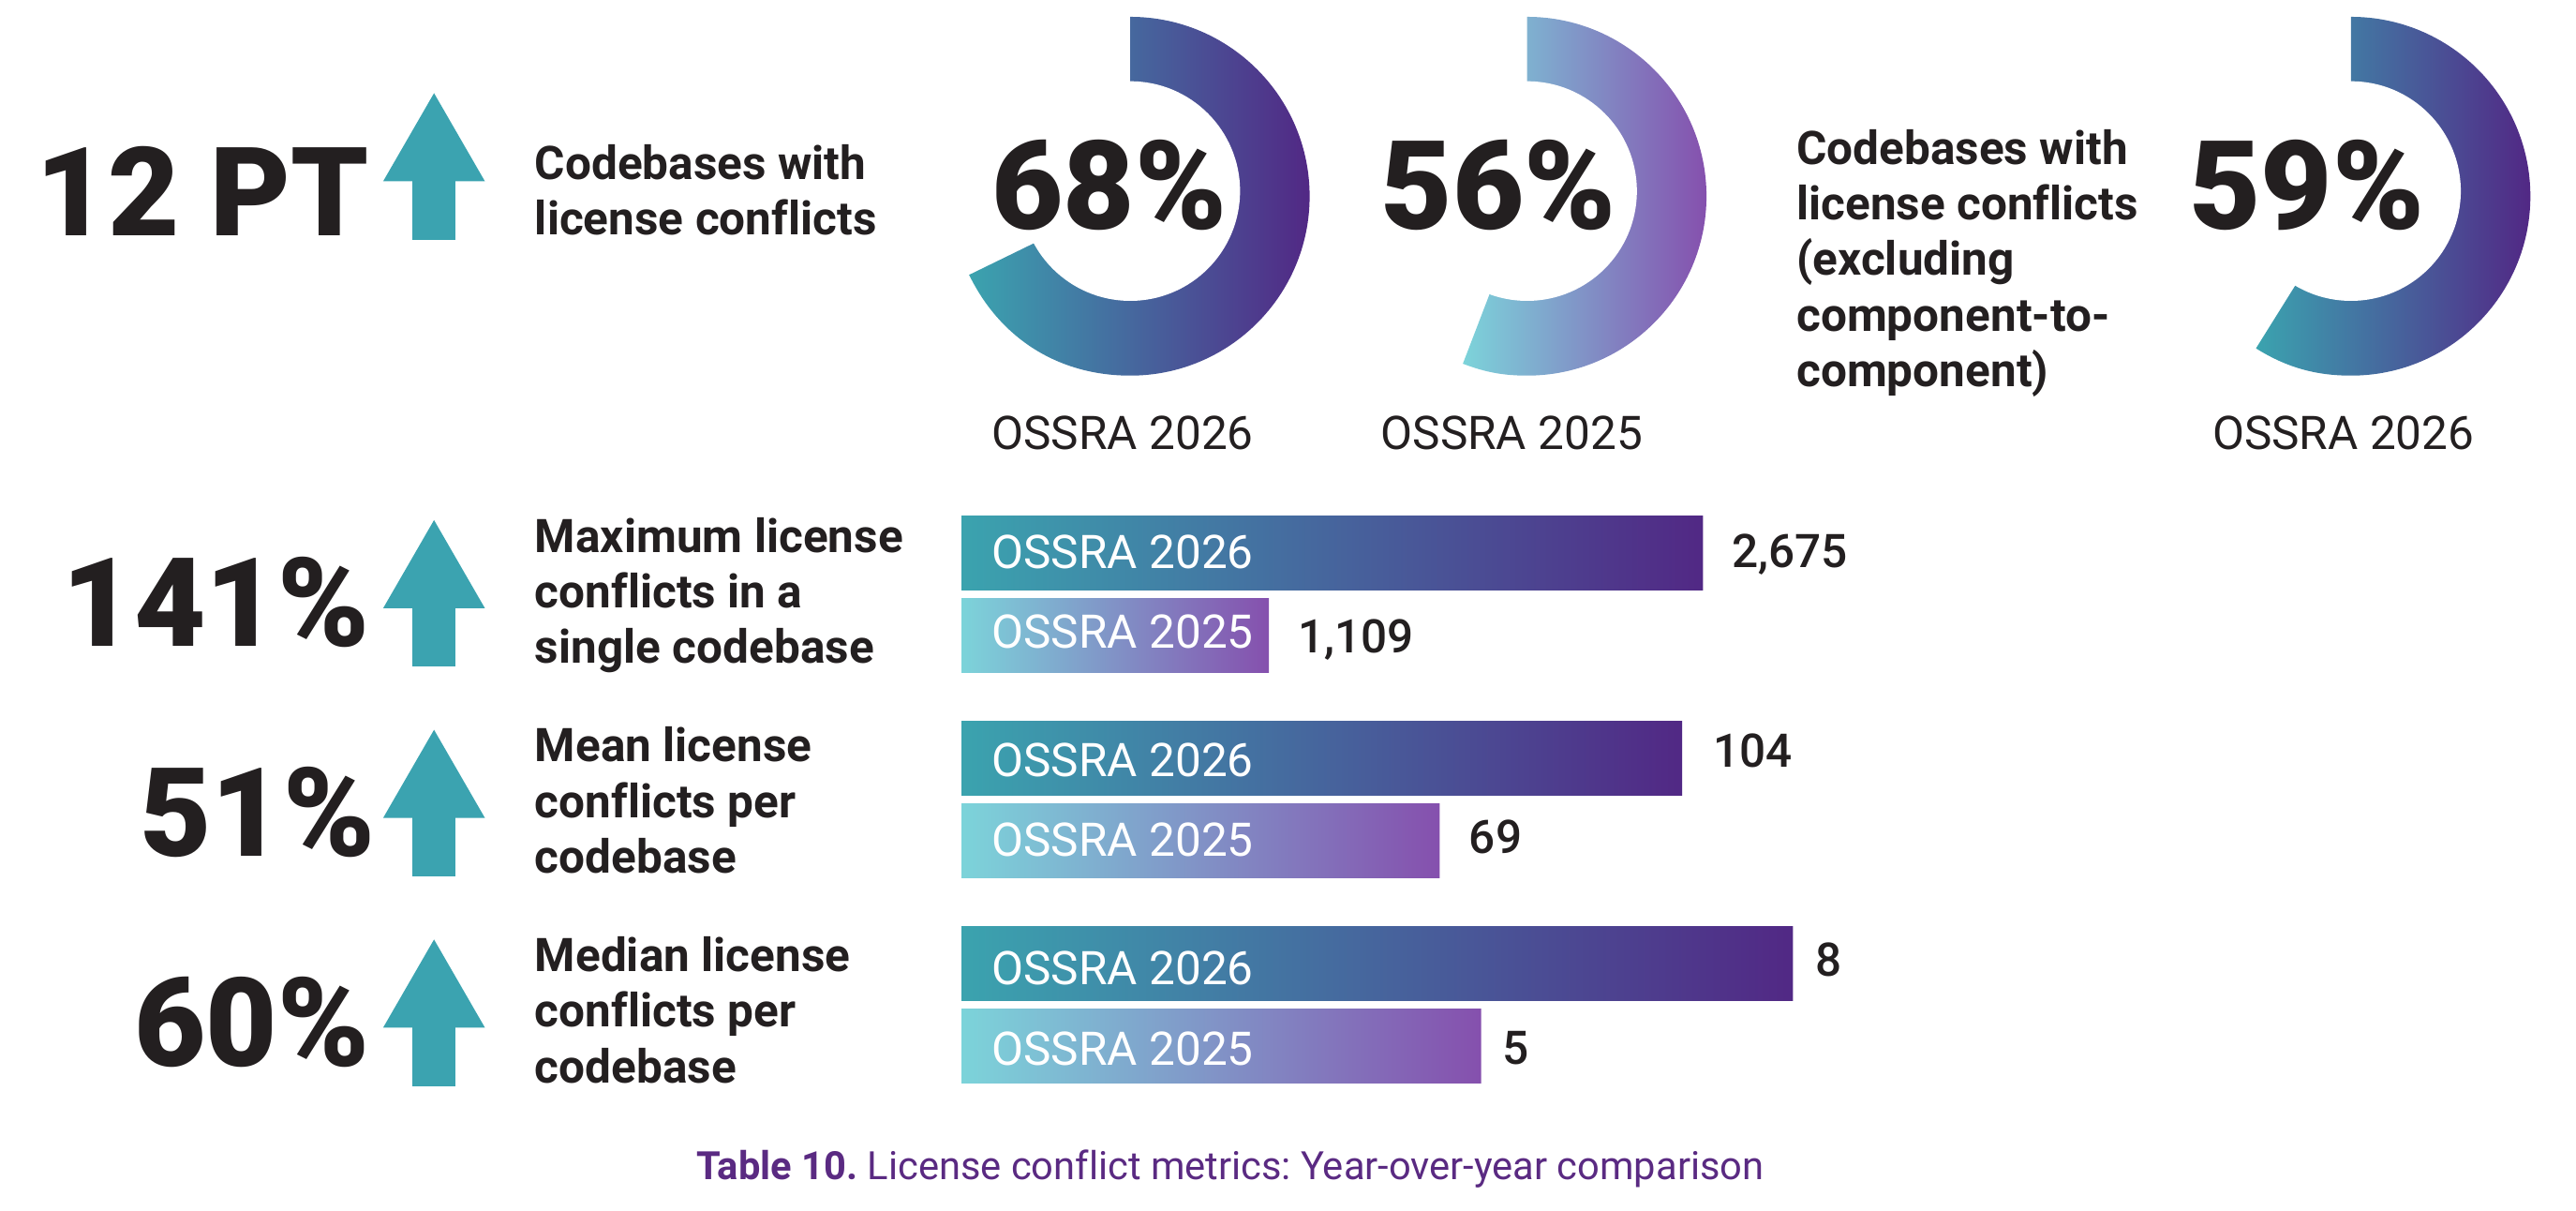
View underlying data — Table 10. License conflict metrics: Year-over-year comparison
| Metric | OSSRA 2026 | OSSRA 2025 | Change |
|---|---|---|---|
| Codebases with license conflicts | 68% | 56% | +12 pts |
| Codebases with license conflicts (excluding component-to-component) | 59% | — | New metric |
| Maximum license conflicts in a single codebase | 2,675 | 1,109 | +141% |
| Mean license conflicts per codebase | 104 | 69 | +51% |
| Median license conflicts per codebase | 8 | 5 | +60% |
Two-thirds of audited codebases contain license conflicts—the highest rate in OSSRA history. The 12-percentage-point increase, from 56% to 68%, represents the largest single-year jump we’ve recorded.
Understanding License Conflicts
The new metric this year—59% of codebases with license conflicts, excluding component-to-component issues—isolates issues that directly affect an organization’s ability to distribute its software as intended. These are the conflicts with the highest potential legal implications.
A license conflict occurs when the terms of one license are incompatible with the terms of another license in the same codebase, or when a component’s license is incompatible with the codebase’s intended distribution model.
Common conflict patterns include:
- Copyleft vs. proprietary distribution. Strong copyleft licenses like GPL require that derivative works be distributed under the same license terms. Including GPL-licensed code in proprietary software—without releasing the proprietary code under GPL—violates the license.
- License version incompatibilities. GPL v2 and GPL v3 are not automatically compatible. Code licensed under “GPL v2 only” cannot be combined with code licensed under “GPL v3 or later” without violating one or both licenses.
- Attribution requirement conflicts. Some licenses require specific attribution formats, placement, or prominence. When multiple components have conflicting attribution requirements, satisfying all of them may be impractical or impossible.
- Component-to-component conflicts. Two open source components in the same application may have mutually incompatible licenses, even if neither conflicts with the application’s own licensing.
Why License Conflicts Are Accelerating
Simply put: more components means more licenses. With average components per application up 30%, the combinatorial complexity of license interactions has increased exponentially. Each new dependency brings its own license, and each license must be compatible with every other license in the dependency tree and with the overall project license.
According to our analyses, 64% of open source components in a typical codebase are transitive dependencies—pulled in automatically by direct dependencies. Developers never explicitly chose these components, yet their code is bound by the components’ license terms. A developer who adds a single library may unknowingly import dozens of transitive dependencies, each with its own license obligations.
An application with 1,180 components (this year’s average) has over 695,000 potential component pairings. Even a small percentage of incompatible pairings produces substantial conflict counts. The 141% increase in maximum conflicts—from 1,109 to 2,675—reflects this compounding effect. More components don’t produce linearly more conflicts; they produce exponentially more potential conflict combinations.
The 2,675 Conflicts Finding
One codebase in our audit contained 2,675 distinct license conflicts—more than double the previous year’s maximum. How does an application accumulate thousands of license conflicts?
- It was a large application with hundreds of direct dependencies
- Each direct dependency brings transitive dependencies
- Transitive dependencies bring their own transitive dependencies
- The dependency tree expands to thousands of components
- Each component pairing creates potential for conflict
- Conflicts multiply in combination as components increase
The codebase in question was associated with a large Gradle project consisting of many JAR files mapped to components that were often licensed under the Apache License 2.0 (2,494, or 77% of the 3,235 identified components, were Apache Licensed). The Apache License is known to have conflicting terms with several other open source licenses, and this produced the large number of conflicts found.
Top 10 Open Source Licenses
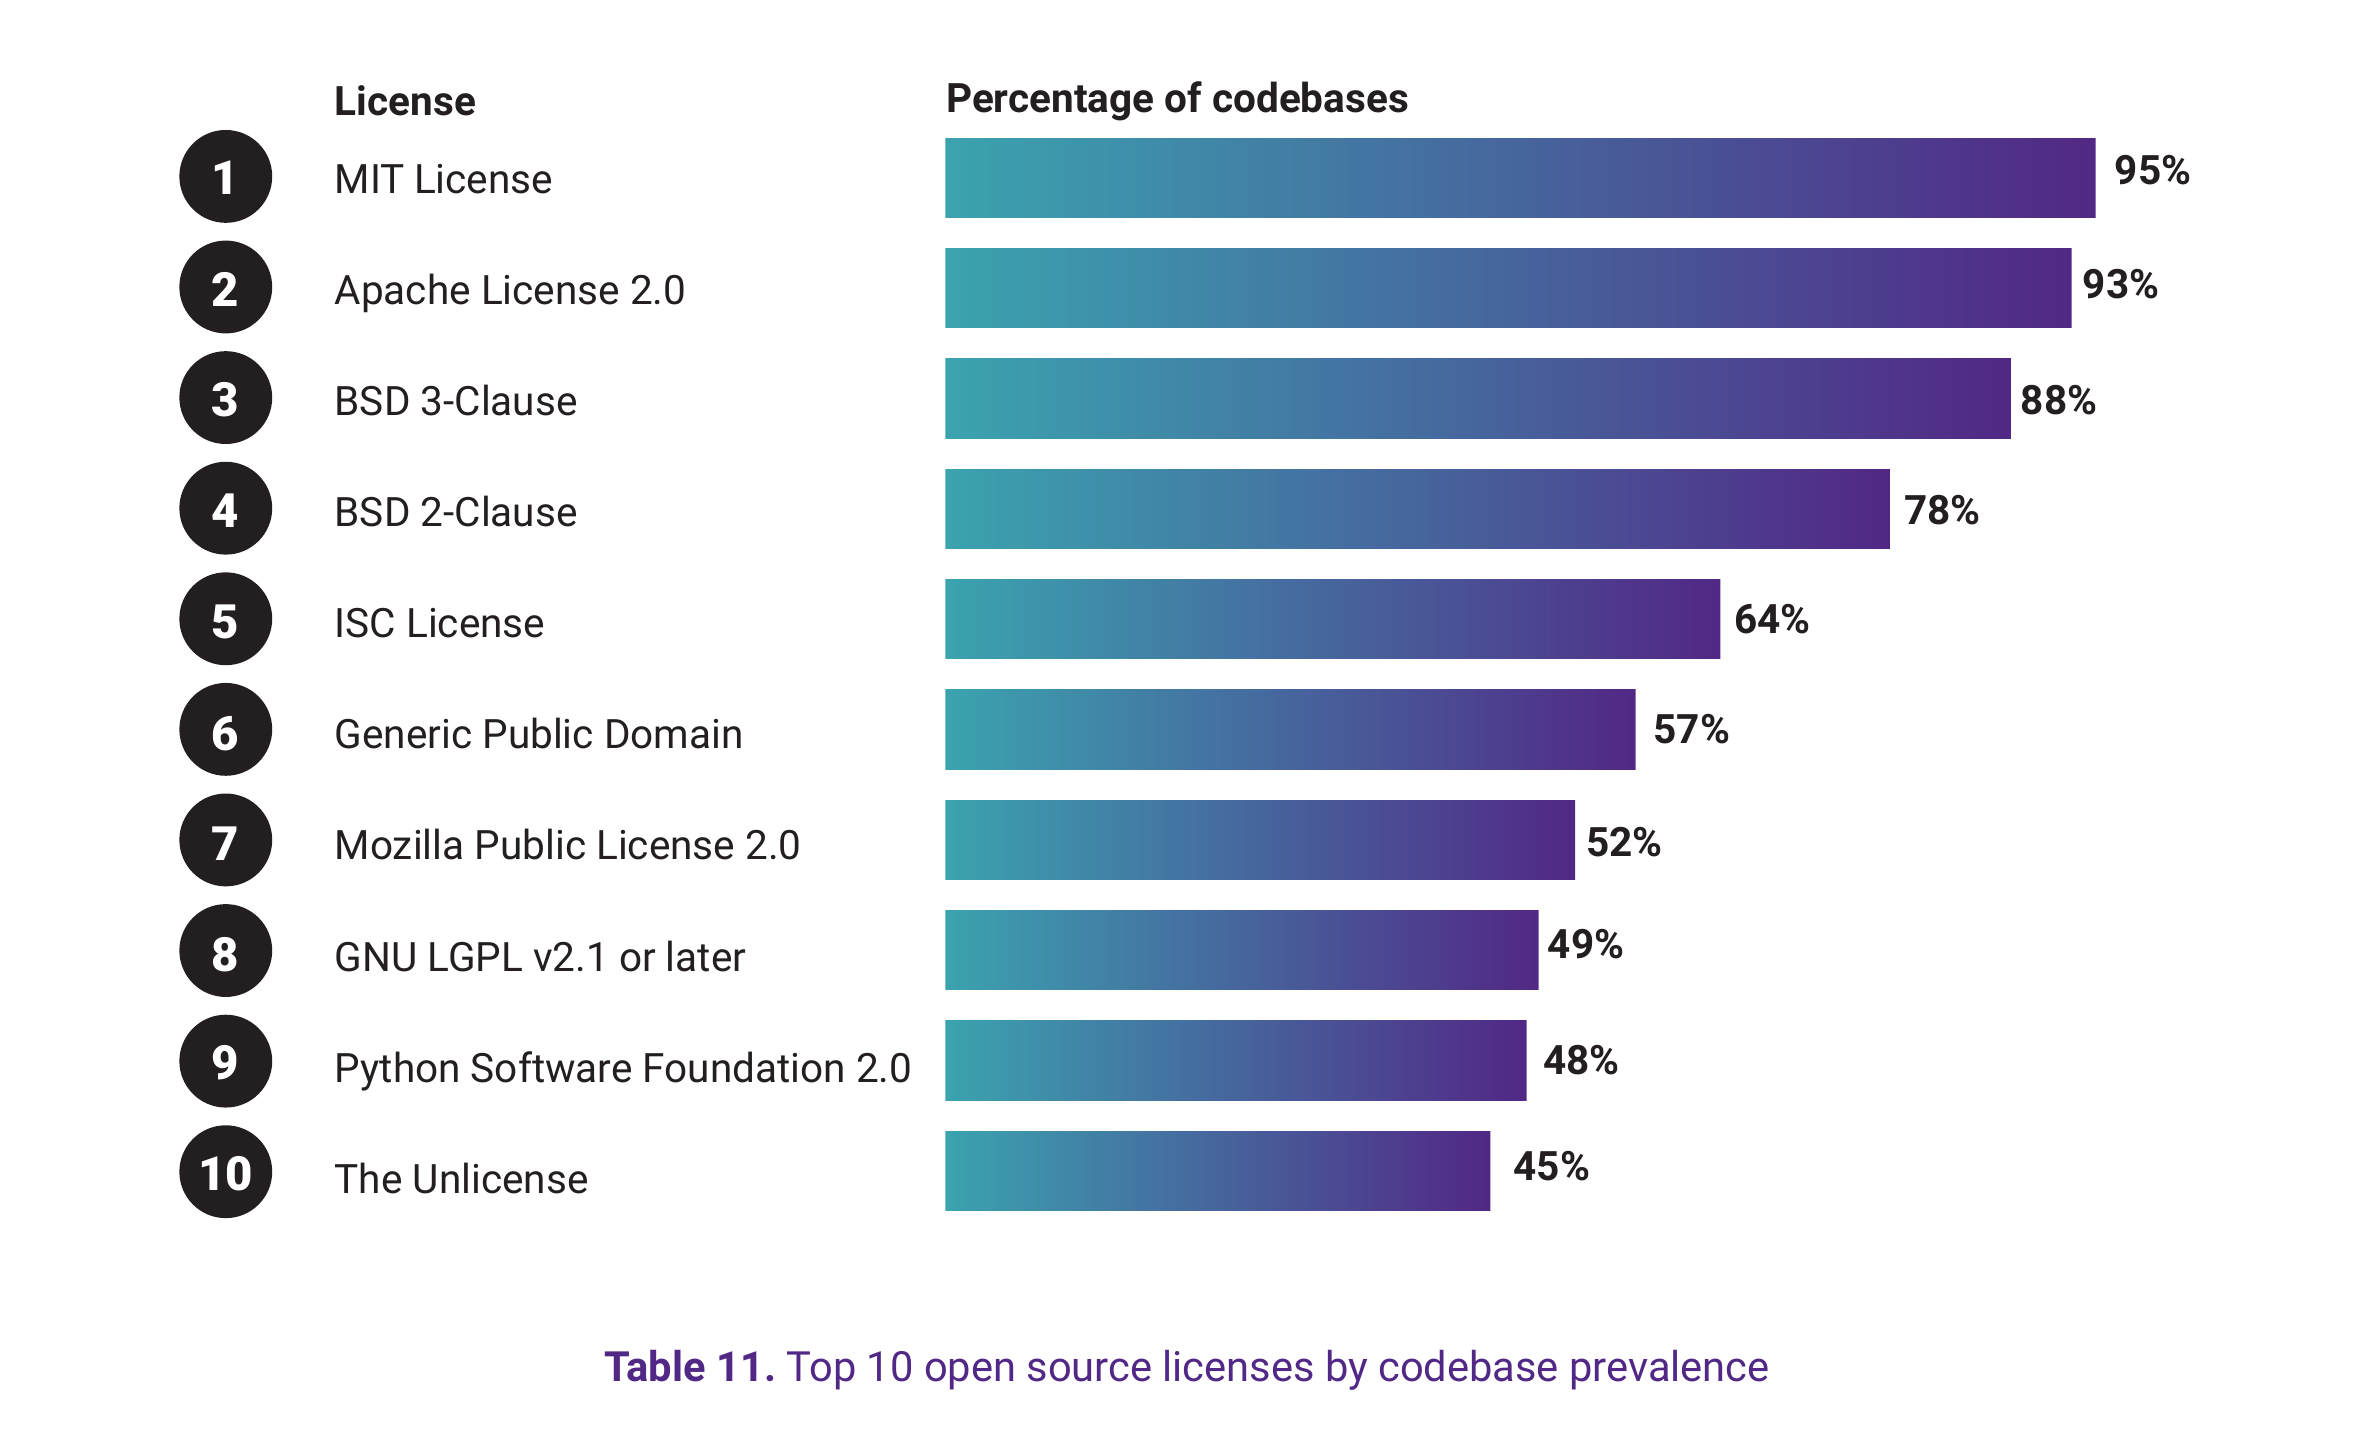
View underlying data — Table 11. Top 10 open source licenses by codebase prevalence
| Rank | License | Percentage of codebases |
|---|---|---|
| 1 | MIT License | 92% |
| 2 | Apache License 2.0 | 90% |
| 3 | BSD 3-Clause | 85% |
| 4 | BSD 2-Clause | 74% |
| 5 | ISC License | 61% |
| 6 | Generic Public Domain | 57% |
| 7 | GNU LGPL v2.1 or later | 48% |
| 8 | The Unlicense | 47% |
| 9 | Creative Commons Zero v1.0 | 46% |
| 10 | Mozilla Public License 2.0 | 45% |
The prevalence of permissive licenses (MIT, Apache, BSD) shown in Table 11 is encouraging—these generally allow commercial use with minimal obligations beyond attribution. But nearly half of the audited codebases contained LGPL-licensed components, which carry weak copyleft obligations that can create compliance complexity, particularly for embedded systems and distributed software where static linking is common.
License Risk Categories
| Category | Risk level | Examples | Key obligation |
|---|---|---|---|
| Permissive | Low | MIT, Apache 2.0, BSD | Attribution in documentation |
| Weak Copyleft | Medium | LGPL, MPL | Share modifications to the licensed component |
| Strong Copyleft | High | GPL v2, GPL v3, AGPL | May require sharing entire derivative work |
The presence of strong copyleft licenses in a commercial codebase isn’t automatically problematic, but it requires careful planning and legal review. The risk is that developers (or AI assistants) add GPL-licensed code without understanding the implications, creating obligations that conflict with business objectives. By the time the conflict is discovered, often during M&A due diligence, remediation may require significant refactoring.
The AI License Challenge
AI coding assistants trained on vast public codebases can inadvertently introduce code from projects with restrictive licenses. The AI model generating the code doesn’t understand licensing; it pattern-matches from its training data. A snippet generated by an AI assistant may originate from a GPL-licensed project, but nothing in the generated code indicates that provenance. This is sometimes referred to as the “license laundering” problem—and it’s invisible to tools that scan only declared dependencies.
Only 54% of organizations evaluate AI-generated code for IP and license risks, and just 24% perform comprehensive IP, license, security, and quality evaluations.
The intersection of AI-generated code and open source licensing remains legally unsettled. Key open questions include:
- Is AI-generated code a derivative work? If a model trained on GPL code produces output like that code, is the output a derivative work subject to GPL terms? Courts haven’t ruled definitively.
- Who owns AI-generated code? Copyright typically vests in human authors. If code is generated by AI, who (if anyone) holds copyright? The developer who prompted the AI? The AI vendor? No one?
- What disclosure is required? If AI-generated code is potentially derived from copyleft sources, what disclosure obligations apply? Are organizations legally obligated to track code that was AI-generated?
- How do indemnification provisions apply? AI coding tool vendors typically disclaim liability for IP issues in generated code. Who bears the risk when AI suggestions create license conflicts?
These questions will be resolved through litigation, legislation, and evolving industry practice over the coming years. In the meantime, organizations using AI coding assistants are accumulating potential exposure they cannot fully quantify.
Components Without Licenses
Beyond conflicts, a significant portion of components present more fundamental problems: they have no license at all, or licenses that cannot be automatically determined.
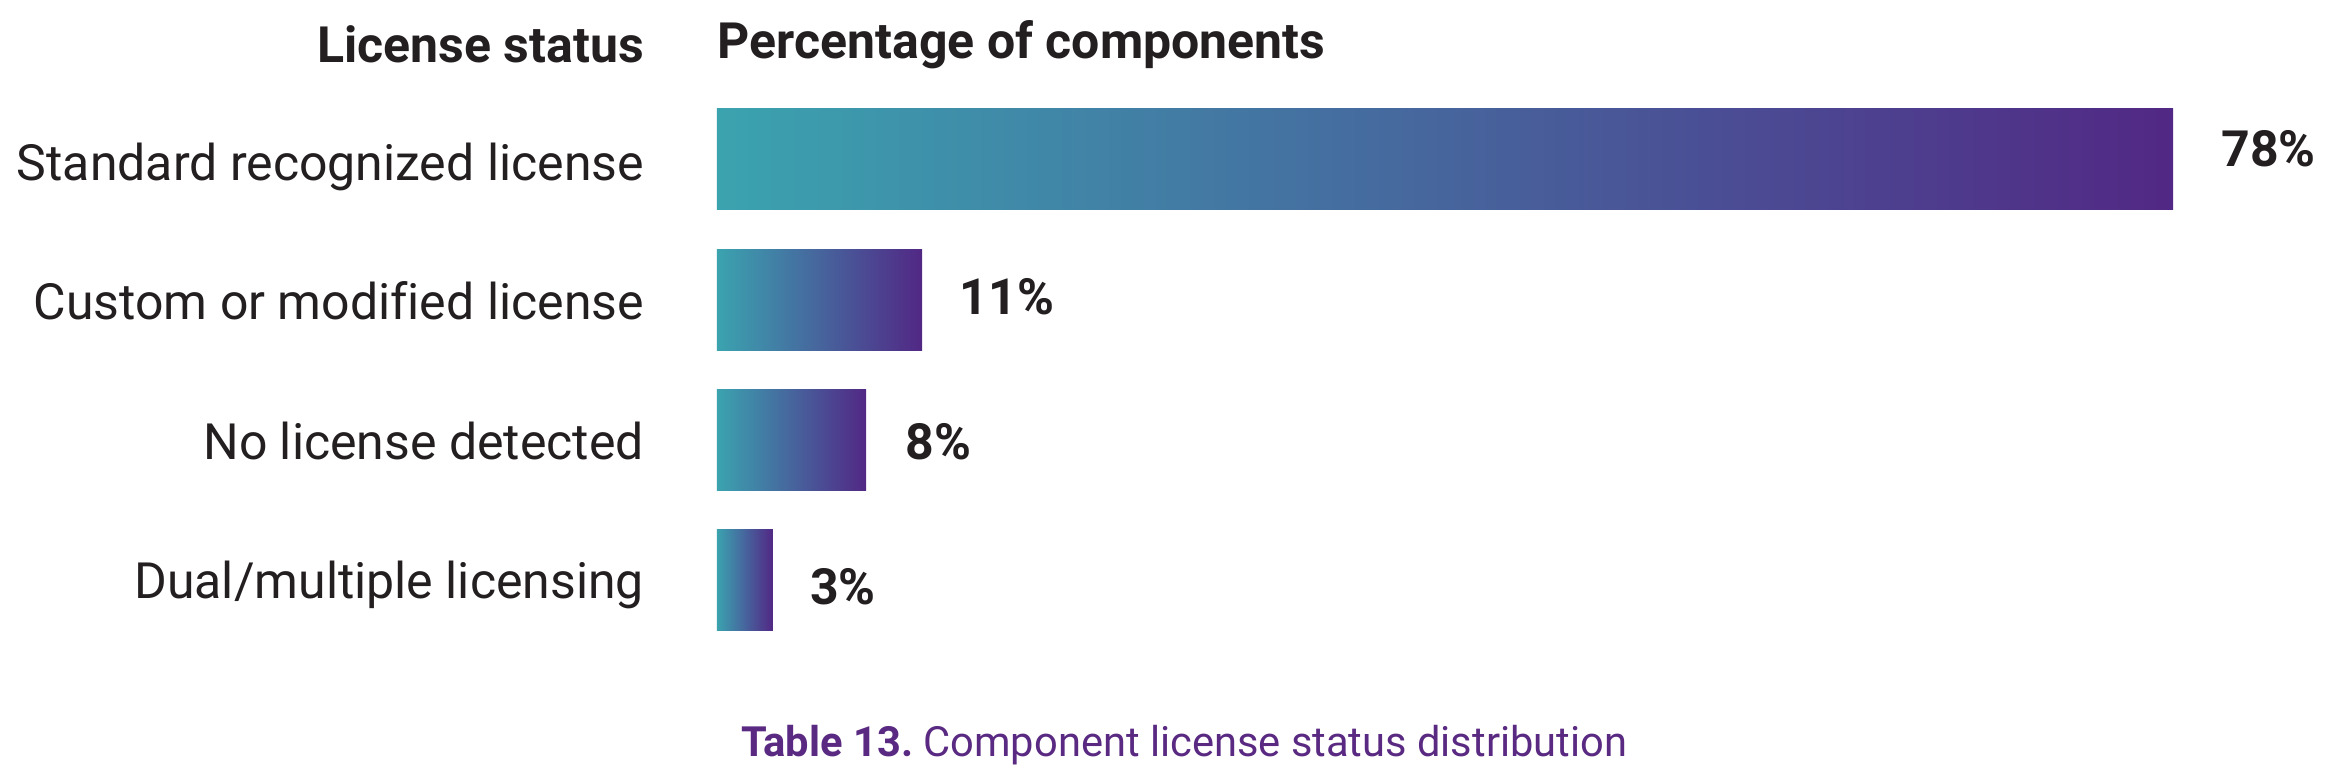
View underlying data — Table 13. Component license status distribution
| License status | Percentage of components |
|---|---|
| Standard recognized license | 78% |
| Custom or modified license | 11% |
| No license detected | 8% |
| Dual/multiple licensing | 3% |
The 8% of components with no detected license represent significant legal exposure. Under copyright law, code without an explicit license grant remains under default copyright—the author retains all rights, and use requires permission. Without explicit terms, organizations using that code have no legal right to do so, regardless of the author’s probable wishes.
The 11% of components with custom or modified licenses require individual legal review—a process that doesn’t scale when hundreds of components are involved.
License Conflicts by Industry
License conflict rates vary significantly across industries, reflecting different technology stacks, distribution models, and compliance cultures. Tables 14 and 15 show the extent of the range by industry in percentage of codebases containing license conflicts.
| Industry | Percentage with conflicts | Primary driver |
|---|---|---|
| Big Data, AI, BI, Machine Learning | 78% | Complex dependency trees, rapid framework evolution |
| EdTech | 74% | Web-heavy stacks, JavaScript ecosystem license diversity |
| Financial Services and FinTech | 72% | Large codebases, multiple integration points |
| Internet and Mobile Apps | 71% | JavaScript/npm ecosystem, high component counts |
| Industry | Percentage with conflicts | Primary driver |
|---|---|---|
| Aerospace, Aviation, Automotive, Transportation, Logistics | 52% | Rigorous component vetting, safety certification requirements |
| Computer Hardware and Semiconductors | 54% | Controlled dependency selection, long development cycles |
| Manufacturing, Industrials, Robotics | 58% | Embedded software discipline, stability prioritization |
Safety-critical industries again show better outcomes. The same discipline that produces lower vulnerability counts also produces lower license conflict rates. When every component requires justification and review, fewer problematic licenses enter codebases.
Practical License Governance
While legal frameworks around AI-generated code evolve, organizations can take pragmatic steps to manage license risk.
- Track AI-generated code. Maintain records of which code sections were AI-generated versus human-written. This enables targeted review and demonstrates good-faith compliance efforts.
- Review AI suggestions before acceptance. Don’t accept AI-generated code heedlessly. Review for potential similarity to known open source patterns, especially for substantial code blocks.
- Configure AI tool settings. Many AI coding tools offer settings to filter suggestions that match public code. Enable these features.
- Include AI code in audits. When conducting license audits, specifically examine AI-generated sections for potential issues that standard dependency-manifest scanning won’t detect.
- Monitor legal developments. The legal landscape will evolve. Stay informed about court decisions, regulatory guidance, and industry best practices as they emerge.
Obsolescence Management and Maintenance Debt
Vulnerabilities make the headlines. License disputes generate legal fees. But the quiet accumulation of unmaintained, outdated, and abandoned components may pose the most insidious risk of all. Unlike a vulnerability with a CVE identifier or a license conflict with clear terms, maintenance debt compounds silently. A direct dependency breaks due to one of its dependencies publishing an incompatible patch and there’s no one to fix it. A compliance audit reveals components that haven’t been touched in years.
This section examines the obsolescence and maintenance landscape revealed in our audit data: the universal prevalence of outdated components, the structural reasons organizations struggle to keep current, and the regulatory pressures—including the CRA—that are making supply chain hygiene a compliance imperative.
The 90% Problem
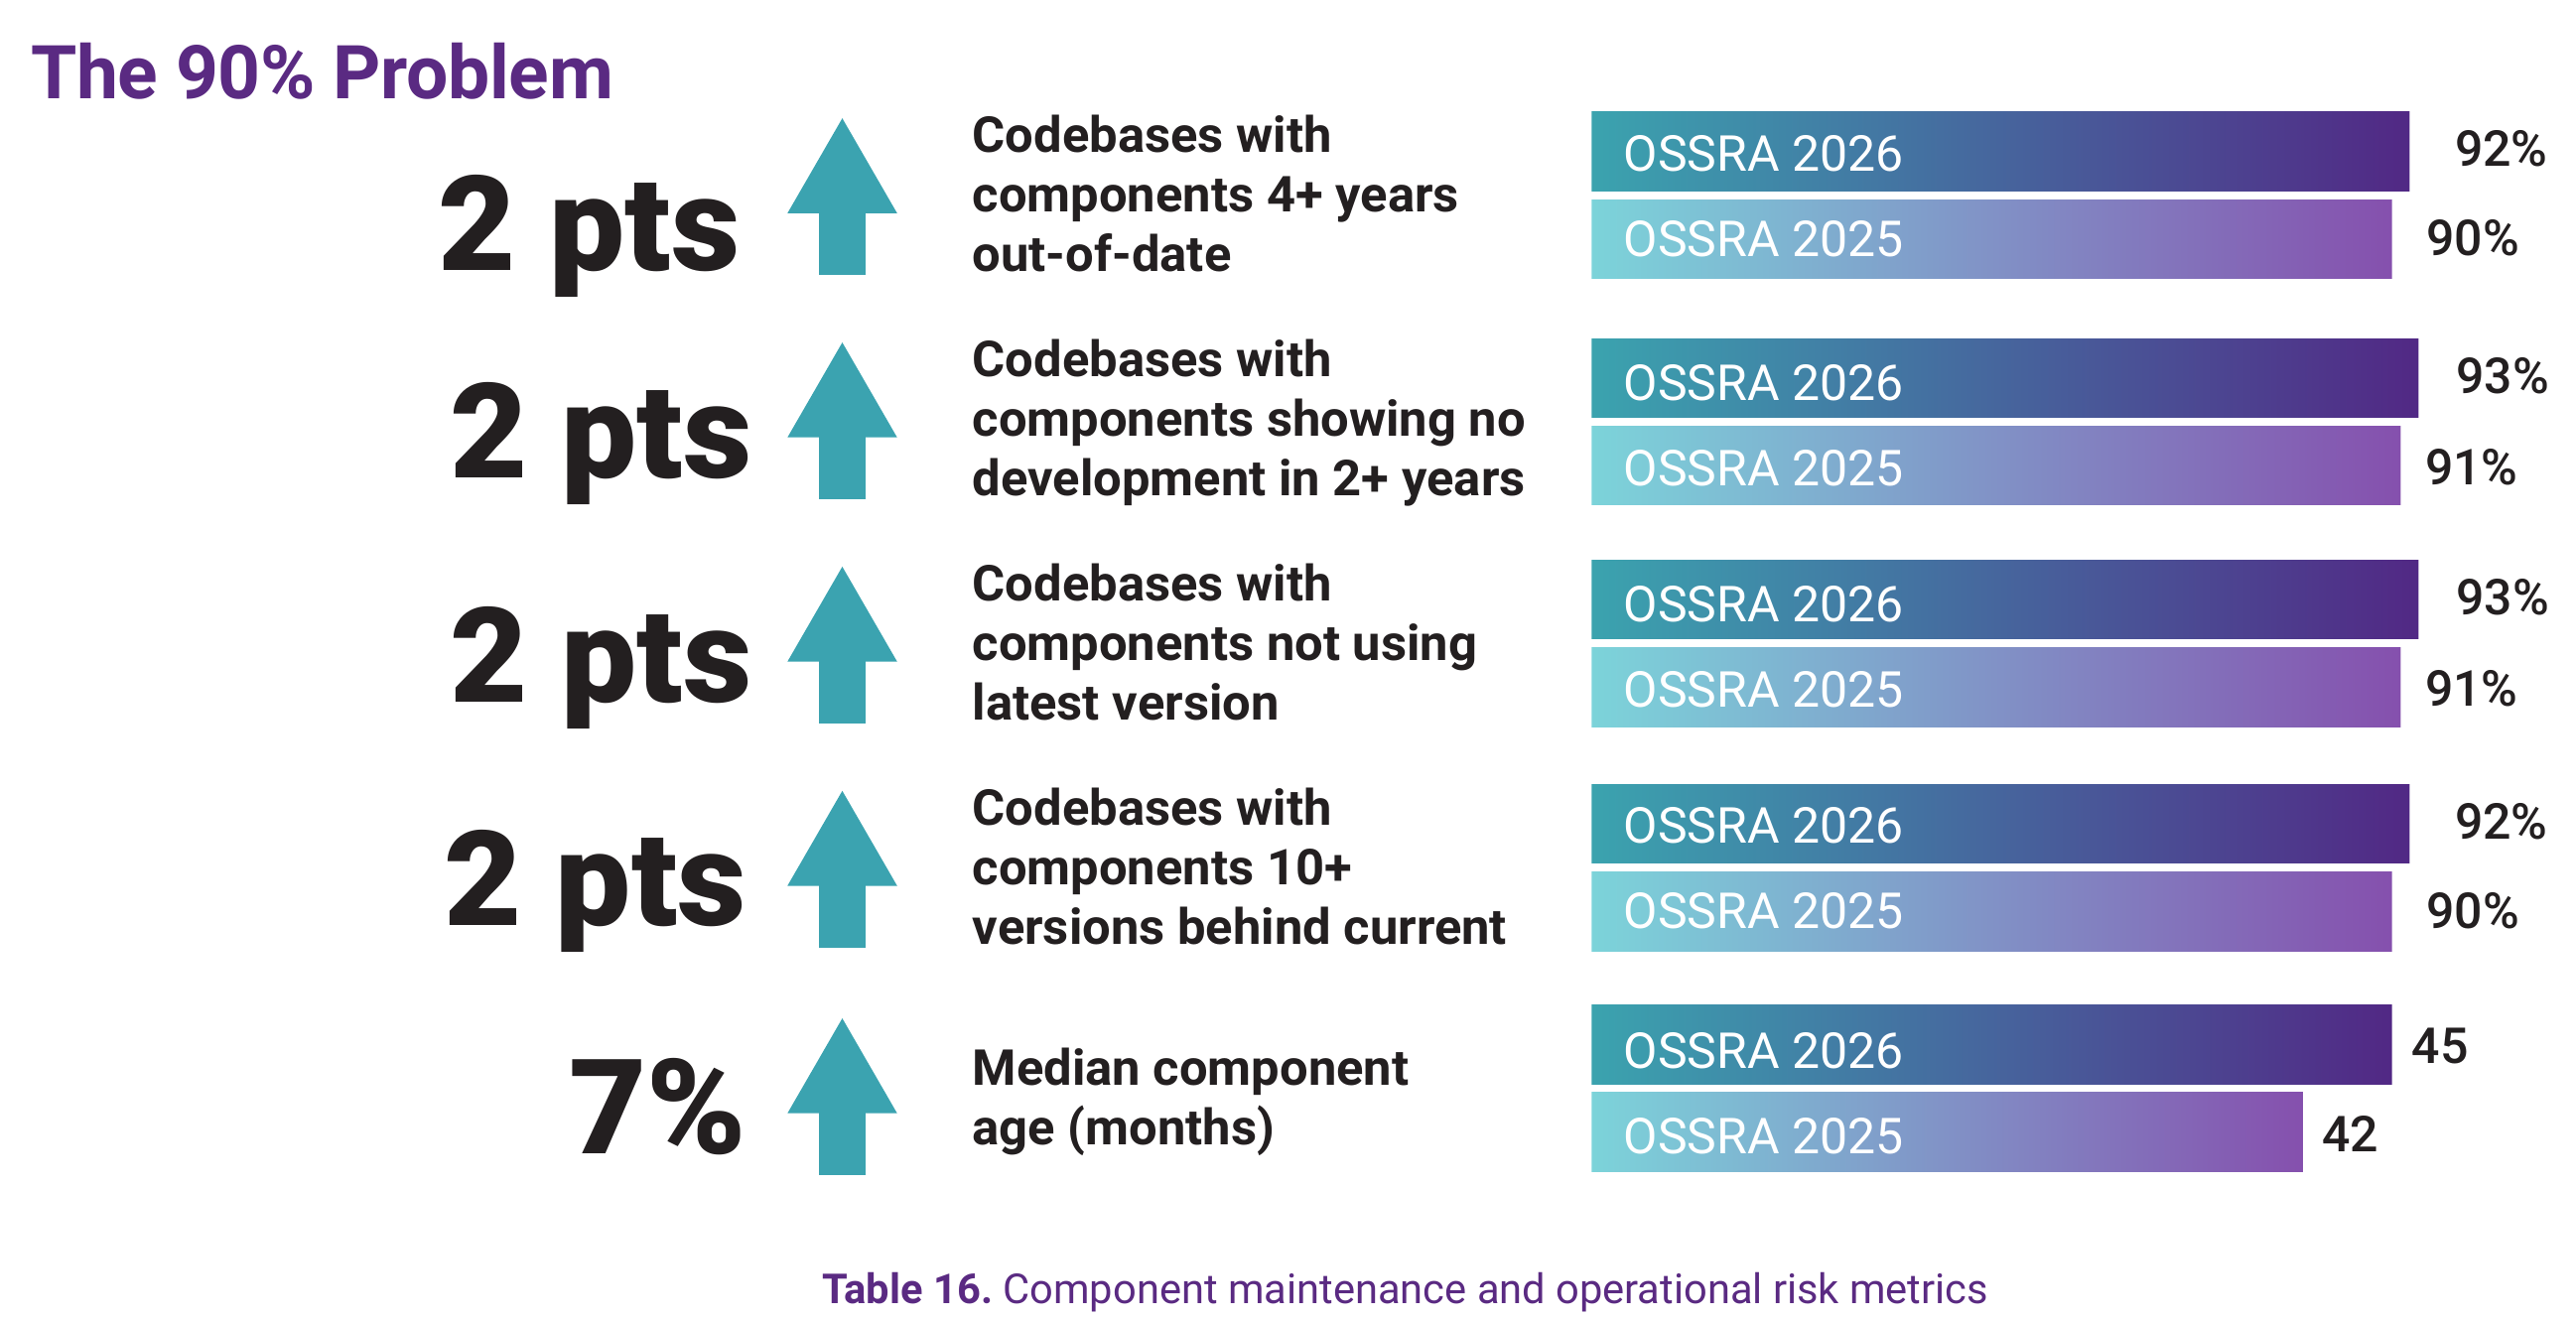
View underlying data — Table 16. Component maintenance and operational risk metrics
| Metric | OSSRA 2026 | OSSRA 2025 | Change |
|---|---|---|---|
| Codebases with components 4+ years out-of-date | 92% | 90% | +2 pts |
| Codebases with components showing no development in 2+ years | 93% | 91% | +2 pts |
| Codebases with components not using latest version | 93% | 91% | +2 pts |
| Codebases with components 10+ versions behind current | 92% | 90% | +2 pts |
| Median component age (months) | 45 | 42 | +7% |
Table 16 shows that every maintenance metric we measure now exceeds 90%. More than 9 out of 10 codebases contain components that are significantly outdated, abandoned by their maintainers, or running versions that are years behind current releases.
The consistency across metrics is notable. Whether measured by calendar time (4+ years out-of-date), development activity (2+ years inactive), version currency (not latest), or version distance (10+ versions behind), the result is the same: an overwhelming prevalence of maintenance debt.
The Zombie Component Problem
A “zombie component” is open source software that continues to exist and be used but receives no active maintenance in its twilight existence. The project may still be available on package registries, still be imported by applications, and still run in production—but no one is responding to reported bugs, verifying that patched vulnerabilities don’t break code, or ensuring compatibility with evolving ecosystems.
Ninety-three percent of the codebases we audited contain components with no development activity in over two years. When a vulnerability is discovered in one of these abandoned projects, there may be no one able to fix it. Organizations face a choice: fork the project and maintain it themselves, find an alternative and refactor, or accept the risk. Each of these options carries its own risks.
Component Age Distribution
View underlying data — Table 17. Component age distribution across audited codebases
| Age range | Component count | Percentage of total |
|---|---|---|
| 0–6 months | 75,189 | 8% |
| 6–12 months | 76,117 | 8% |
| 12–18 months | 75,148 | 8% |
| 18–24 months | 71,847 | 7% |
| Older than 24 months | 651,222 | 68% |
More than two-thirds of all components in audited codebases are over two years old. The long tail of aging components represents years of accumulated decisions—dependencies added, never updated, and eventually forgotten. Each one is a potential liability waiting to be discovered.
Version Currency
View underlying data — Table 18. Component version currency status
| Version status | Percentage of components |
|---|---|
| Latest version | 7% |
| 1–2 versions behind | 12% |
| 3–5 versions behind | 18% |
| 6–10 versions behind | 22% |
| 10+ versions behind | 41% |
As Table 18 demonstrates, only 7% of components in the audited codebases are running the latest available version. The majority—41%—are 10 or more versions behind.
The Update Question
Why don’t organizations simply update their components? The answer is friction.
- Breaking changes. Major version updates often introduce API changes that require code modifications. A simple npm update can cascade into hours of refactoring.
- Transitive conflicts. Updating one component may conflict with the version requirements of another. Dependency resolution becomes a puzzle where solving one constraint creates new violations elsewhere.
- Testing burden. Every update requires validation—unit tests, integration tests, regression tests. Each test cycle competes with feature development for limited resources.
- “If it ain’t broke.” Components that work tend to be left alone. The calculus is understandable: why risk breaking something that’s functioning? But here’s the answer—because unpatched vulnerabilities accumulate.
The result is a widening gap between vulnerabilities discovered and patches applied. According to our DevSecOps survey, 60% of organizations are now deploying code to production daily or more frequently. But their component update cycles are measured in months or years. This mismatch—fast feature development, slow security maintenance—is the essence of security debt.
The EU Cyber Resilience Act
Overall product cybersecurity hygiene is becoming a compliance requirement. The CRA, which took effect in December 2024 and has its first major compliance requirement in September 2026, introduces significant new obligations for software vendors selling products in the European market. For organizations struggling with the maintenance debt documented in this report, the CRA represents a risk that can’t be ignored—address vulnerabilities or face severe penalties or loss of access to the European market.
What the CRA Requires
The CRA is a horizontal European regulatory framework establishing mandatory cybersecurity requirements for all products that either are software or are powered by software—referred to as products with digital elements—sold in the EU market. Its requirements apply to any manufacturer, distributor, or importer placing products on the European market, regardless of where the manufacturer of the product is based.
The regulation has a phased approach:
- December 10, 2024: CRA entered into effect
- September 11, 2026: Vulnerability reporting requirements become mandatory
- December 11, 2027: All CRA requirements become fully applicable, with enforcement and penalties
Support Period Obligations
If an organization ships a product containing an open source component that has a potentially exploitable vulnerability, even if that vulnerability was disclosed after the product shipped, that organization cannot meet the CRA’s requirement to “handle vulnerabilities effectively” for that product if it can’t resolve potential exploit paths in a timely and transparent manner.
At the heart of the CRA is a requirement that products with digital elements are placed on the European market free from known vulnerabilities. This represents a commitment by the manufacturer to handle vulnerabilities effectively throughout the product’s support period. The support period must be transparent to users of the product and represent the reasonable lifespan of the product. Absent a shorter product lifespan, the CRA expects vulnerability management for a minimum of five years.
Manufacturers must maintain access to security updates for 10 years after the end of the support period, as well as maintain regulatory access for all technical documentation relating to its cybersecurity policies, practices, and decisions for at least 10 years.
This has direct implications for open source governance and component selection. If a manufacturer ships a product containing an open source component that has a known exploitable vulnerability, they have obligations to meet. If they ship with an obsolete version of a component, they have obligations to meet. If they fail to triage vulnerabilities reported to the component maintainers, they have obligations to meet. How the manufacturer handles these obligations determines if they meet the expectations of the CRA. If those expectations aren’t met, the penalties are percentages of the manufacturers’ global revenue.
Consider this in light of our audit findings: 93% of codebases contain components with no development activity in over two years. These “zombie components” represent potential CRA compliance gaps. If a vulnerability is disclosed in one of these abandoned projects after a product ships, the manufacturer faces a choice: fork the project and maintain it themselves, find an alternative and refactor the product, or accept the potential for CRA penalties. None of these options are simple or inexpensive.
Vulnerability Reporting
Beginning September 2026, manufacturers, distributors, and importers must report actively exploited vulnerabilities and severe security incidents to the Computer Security Incident Response Team (CSIRT) designated as coordinator of the Member State where they have their main establishment, as well as to ENISA, the EU agency for cybersecurity.
The reporting timeline is aggressive but does allow for coordinated embargoes.
- Initial notification within 24 hours of becoming aware of a vulnerability known to be exploitable (e.g., proof-of-concept code is available)
- Follow-up notification within 72 hours of triage confirming that the product with digital elements is potentially exploitable to the vulnerability
- Final report within 14 days after a corrective measure, such as a patch, is available
This 24-hour requirement demands that manufacturers don’t rely on continuous scanning of codebases and instead have an accurate, complete, and clear inventory indicating component usage and version—an SBOM.
SBOM Requirements
The CRA mandates that manufacturers create and maintain an SBOM encompassing at least the product’s direct dependencies. While manufacturers are not required to make their SBOM publicly available, market surveillance authorities, such as ENISA and CSIRTs, may request it for validation, audit, or incident investigation purposes.
The SBOM must be kept current throughout the product’s lifespan and support period, ensuring that any component change or patch is reflected in the documentation. This is an ongoing obligation tied to the product life cycle.
The requirements align with evolving international standards. CISA’s 2025 draft guidance on SBOM generation demands precise identification of upstream suppliers, automation-ready formats (CycloneDX, SPDX), and critically, the inclusion of transitive dependency data. Given that 64% of open source components in a typical codebase are transitive dependencies, this last requirement is significant. Organizations must document the libraries they chose and the libraries those libraries depend on.
Open Source Stewards: Bridging Commercial Support and OSS
Open source stewards are defined as a legal entity that voluntarily and specifically performs security analysis, including publishing patches, for defined open source libraries.
The CRA introduces a novel category of economic actor: the “open source steward.” Where most people understand the role a manufacturer plays in the secure development of their products, open source is different. Some open source projects are extremely popular and attract many developers. Linux or Kubernetes are perfect examples of such efforts. Other projects are just as impactful but have fewer developers, such as OpenSSL or Log4J. And some projects may have fewer than 10 people involved in their development.
Historically, a commercial support model for open source meant buying support from entities that distribute versions of specific libraries. Red Hat Linux is a perfect example of this model. But where Red Hat provides support for a fee covering its distribution, the upstream projects in that distribution remain community supported.
The CRA seeks to ensure that all third-party code is supported, and to meet this objective it defined the role of “open source steward.” At its core, an open source steward takes responsibility for an open source component and its maintenance. There is no default open source steward for any given open source project, and stewards aren’t obligated to be a “steward for life.” Although foundations such as the Apache Software Foundation, the Eclipse Foundation, and the Linux Foundation are expected to become stewards, maintainers of small projects are also eligible. Open source stewards aren’t subject to the penalties that manufacturers are, but they do have obligations to report exploitability information and coordinate resolution of vulnerabilities.
Steward obligations include:
- Establishing and documenting a cybersecurity policy to foster secure development and effective vulnerability handling
- Cooperating with market surveillance authorities and taking corrective actions when requested
- Reporting actively exploited vulnerabilities (to the extent they are involved in the product’s development)
- Reporting severe incidents affecting the network and information systems they use in the development or maintenance of the product
For organizations consuming open source, these obligations have practical implications. Projects governed by established foundations—those with formal stewardship—will have documented cybersecurity policies and vulnerability-handling processes. Projects maintained by individual developers or informal communities may not. This doesn’t make ungoverned projects less valuable, but it does make their maintenance trajectory less predictable—a factor that matters when selecting components for products that must remain compliant for five or more years.
Supply Chain Accountability
The CRA fundamentally changes how supply chain compliance works. Previously, for most manufacturers of products with digital elements, compliance was a matter of internal policies and legal agreements with direct vendors. The CRA extends accountability to the entire software supply chain, including open source components.
Manufacturers must conduct cybersecurity risk assessments that include inspection of third-party components integrated into the final product. When a manufacturer learns of a potential vulnerability in a product component—including third-party and open source components—it must report the vulnerability to the entity maintaining the component. Importers and distributors must inform manufacturers of any vulnerabilities identified in products they handle.
This creates a chain of accountability that flows through the entire ecosystem. A vulnerability in a transitive dependency—a component the development team never explicitly chose—becomes the manufacturer’s responsibility to track, report, and remediate.
Implications for Component Governance
The CRA recognizes that the “ship and forget” product security model that has allowed maintenance debt to accumulate across the industry has negatively impacted users of digital products for years. Organizations selling software in the EU market must:
- Understand component life cycle at selection time. The five-year minimum support period means organizations must evaluate the maintenance trajectory of open source components before incorporating them—not just discover EOL status after a version of the product is released. Components from projects with active maintainers, established governance, and clear roadmaps present lower compliance risk than components from projects showing signs of abandonment.
- Track component status continuously. A component that was actively maintained when selected may become abandoned or obsolete during the lifespan of the product. Organizations need ongoing visibility into the maintenance status of their dependencies—direct and transitive—to identify compliance risks before they become compliance failures.
- Maintain current SBOMs. The CRA’s requirement for life cycle–maintained documentation means SBOMs must be regenerated with each product update, including patches.
- Establish vulnerability response processes. The 24-hour reporting requirement demands mature and automated vulnerability management processes. Organizations must be able to identify if a vulnerability—whether newly disclosed or previously disclosed but with no exploitability information—affects their products and then initiate reporting. That reporting needs to be done within a single day. If the vulnerability does impact the product once triage is performed, additional reporting is required within 72 hours.
The OSSRA data suggests software development teams have significant work ahead. With 92% of codebases containing components four or more years out-of-date, and 93% containing components with no development activity in two years, most organizations are starting from a position of substantial maintenance debt. The CRA provides a regulatory forcing function—but the remediation work required is substantial and deadlines are fast approaching.
The Cyber Resilience Act makes supply chain hygiene a compliance imperative. Organizations selling software in the European market must have robust cybersecurity programs and be able to respond to exploitable vulnerabilities within 24 hours.
Industry Maintenance Patterns
Maintenance practices vary significantly across industries, reflecting different development cultures and regulatory environments.
View underlying data — Table 19. Industries with best component maintenance practices
| Industry | Percentage of components <1 year old | Percentage using latest version |
|---|---|---|
| Aerospace, Aviation, Automotive, Transportation, Logistics | 34% | 18% |
| Computer Hardware and Semiconductors | 31% | 15% |
| Manufacturing, Industrials, Robotics | 29% | 14% |
| Healthcare, Health Tech, Life Sciences | 27% | 12% |
Safety-critical industries consistently show better maintenance metrics—probably not because they update more aggressively, but because they add dependencies more carefully. Fewer components mean fewer maintenance obligations. Rigorous vetting processes filter out components without strong maintenance track records.
View underlying data — Table 20. Industries with poorest component maintenance practices
| Industry | Percentage of components <1 year old | Percentage using latest version |
|---|---|---|
| Internet and Mobile Apps | 14% | 5% |
| Marketing Tech | 13% | 4% |
| Big Data, AI, BI, Machine Learning | 15% | 6% |
| EdTech | 16% | 5% |
Fast-moving sectors with high component counts show the poorest maintenance metrics. The JavaScript/npm ecosystem common in these industries produces particularly large dependency trees with rapid version churn—a combination that makes keeping current especially difficult.
The Value of Discipline
The good news: Effective dependency management makes a measurable difference. According to Black Duck’s supply chain security research, organizations that are highly effective at tracking and managing open source dependencies are significantly more prepared to secure their open source software—85% versus just 57% for the overall survey population.
The challenge is that fewer than half of organizations rate themselves as highly effective at this fundamental practice. Maintenance debt doesn’t stabilize—it grows. Skipped updates make future updates harder, increasing the likelihood of skipping future updates. The cycle accelerates until external forcing functions—security incidents, compatibility failures, regulatory requirements like the CRA—mandate action.
The organizations with the best outcomes are those that invest in component governance—thorough, careful component selection; continuous monitoring; and disciplined update practices—before they are forced to do so. The investment pays dividends not just in reduced maintenance burden but in reduced vulnerability exposure and smoother compliance when regulations demand accountability.
Yesterday’s Gone: Living in the AI Era
Software development has entered a new era. The tools developers use, the speed at which they work, and the volume of code they produce have all transformed in the span of 18 months. AI coding assistants—GitHub Copilot, Cursor, Claude Code, Amazon Q, Windsurf, Tabnine, and others—have moved from experimental curiosities to essential infrastructure.
This section examines what our data reveals about AI adoption, the governance challenges organizations face, and how these trends connect to the risk patterns documented throughout this report.
AI Coding Adoption: The Scale
The adoption curve for AI coding assistants has been steeper than almost any technology in software development history. What began as autocomplete suggestions has evolved into full-function code generation.
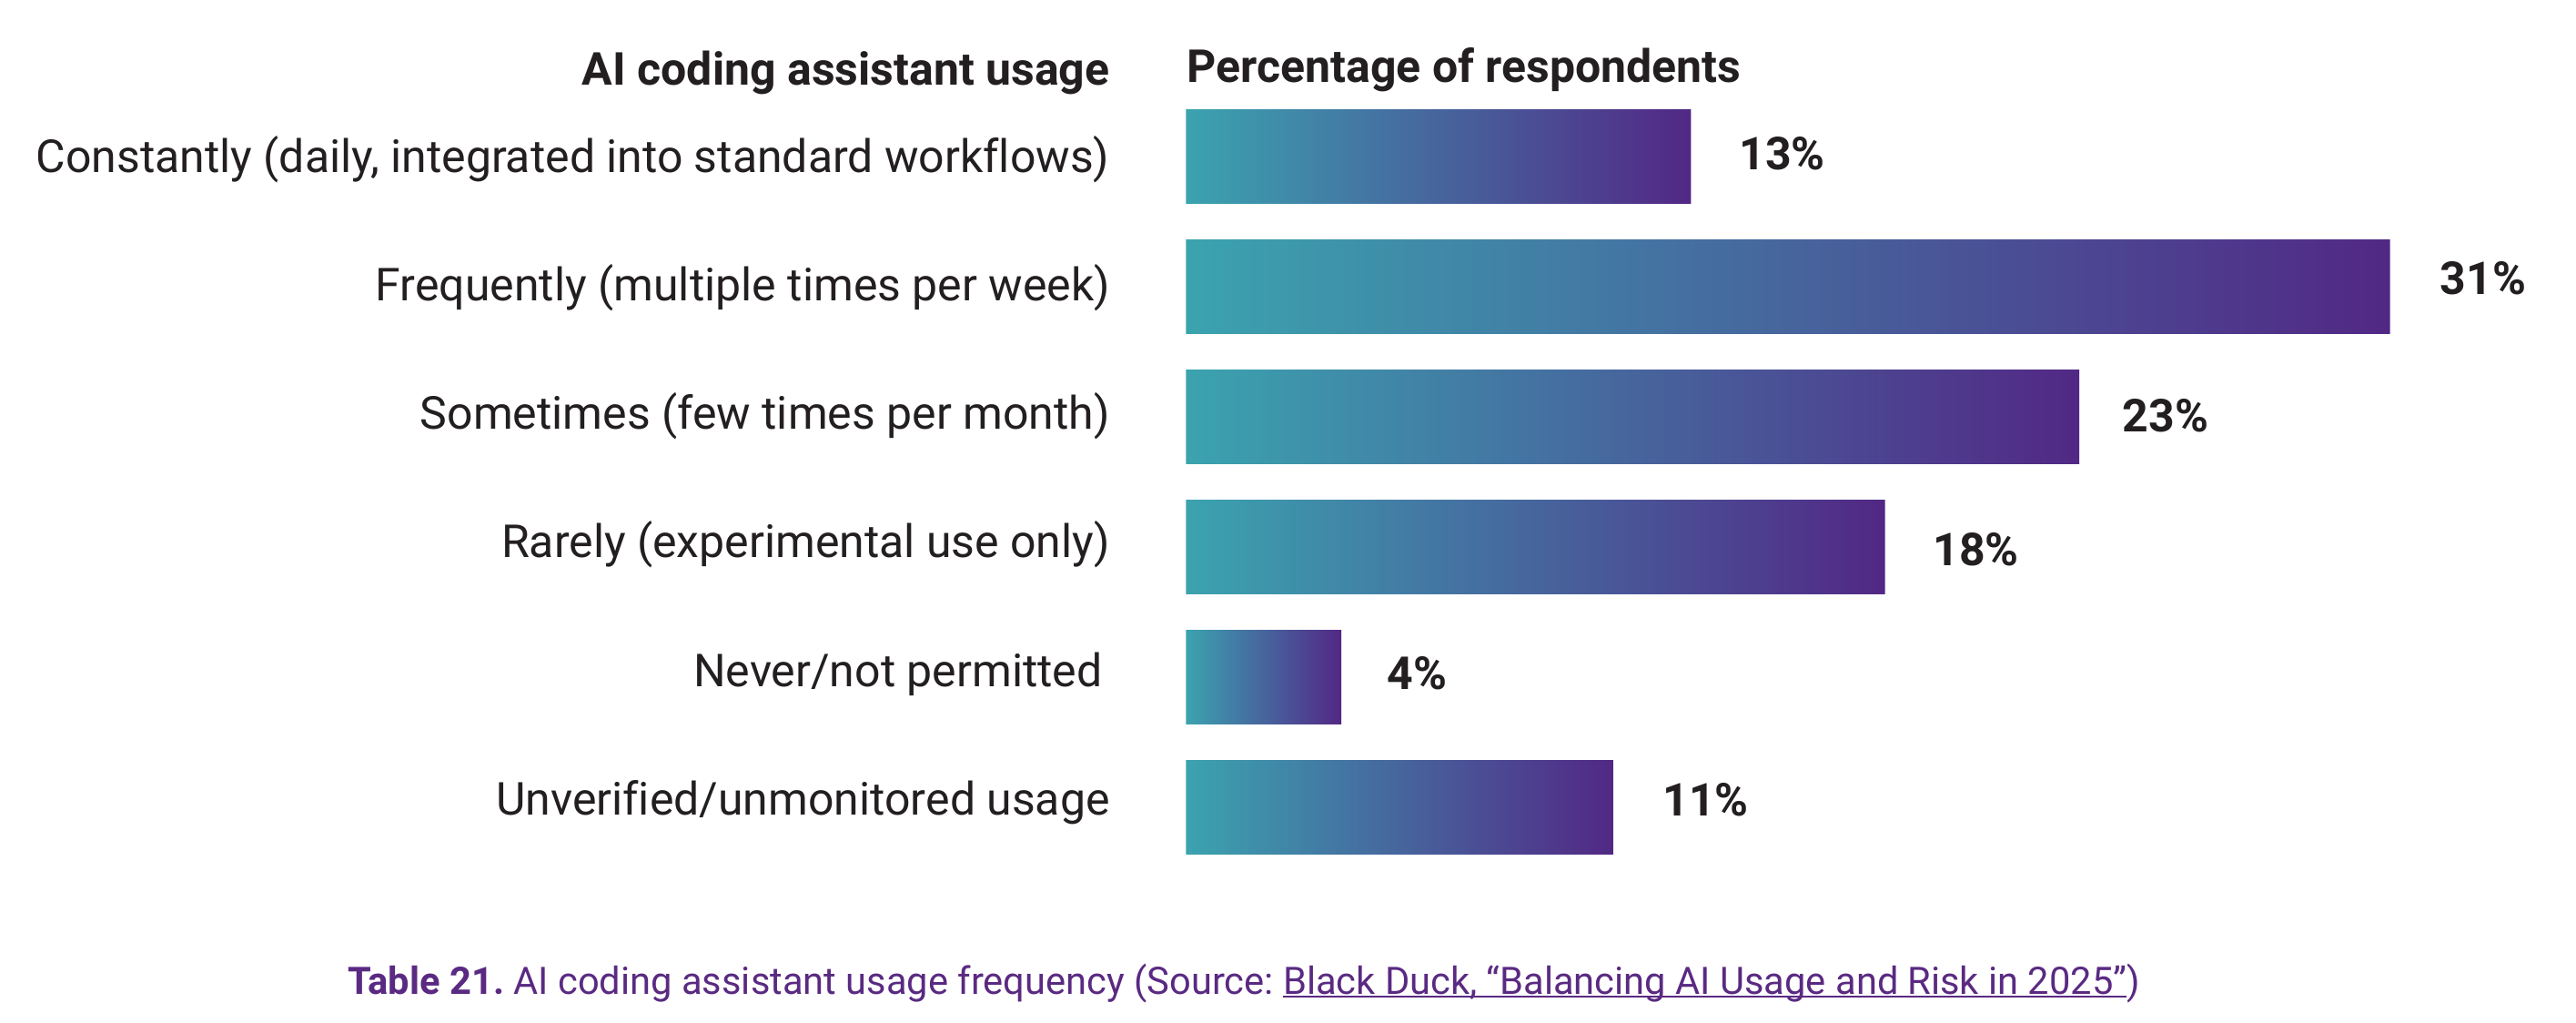
View underlying data — Table 21. AI coding assistant usage frequency
| AI coding assistant usage | Percentage of respondents |
|---|---|
| Constantly (daily, integrated into standard workflows) | 13% |
| Frequently (multiple times per week) | 31% |
| Sometimes (few times per month) | 23% |
| Rarely (experimental use only) | 18% |
| Never/not permitted | 4% |
| Unverified/unmonitored usage | 11% |
Forty-four percent of DevSecOps professionals now use AI coding assistants frequently or constantly—and they are deeply integrated into daily workflows. Add for occasional users, more than three-quarters of the industry has adopted these tools to some degree.
Black Duck’s “State of Embedded Software Quality and Safety” report corroborates these findings from a different angle: 89.3% of embedded software organizations have developers using AI assistants. In an industry known for conservative technology adoption, AI coding tools have nonetheless achieved widespread penetration.
The adoption extends beyond code generation. Our DevSecOps survey found that 97% of organizations are using open source AI models (such as those from Hugging Face) in their development workflows. However, the transition from experimentation to production is more selective. According to Black Duck’s supply chain security research, only 49% of organizations incorporate open source AI/ML models directly into the software they ship. AI has become both the means of production and, increasingly, part of the product itself.
The Governance Gap
While AI adoption has been rapid, governance practices have not kept pace.
Only 24% of organizations perform comprehensive IP, license, security, and quality evaluations for AI-generated code.
According to Black Duck’s supply chain survey, 76% of respondents said their organizations check AI-generated code for security risks, but only 54% evaluate it for IP and license risks, and just 56% assess quality issues. Altogether, only 24% perform comprehensive IP, license, security, and quality evaluations for AI-generated code—leaving significant oversights in software supply chains.
This governance gap matters because of what AI assistants actually do in practice.
Dependency selection. When generating code, AI assistants frequently suggest imports and dependencies. A request to “parse JSON dates” might generate code that imports moment.js, date-fns, or dayjs—with the AI making the selection based on training data patterns, not security or maintenance considerations.
Pattern replication. AI models are trained on vast codebases. When they generate code, they replicate patterns from that training data—including coding styles, architectural approaches, and potentially vulnerabilities. A pattern that appears frequently in training data will appear frequently in generated code, regardless of whether it’s secure.
The dependency multiplication effect. When a developer manually adds a dependency, there’s at least a moment of consideration: Do I need this? Is it maintained? What does it pull in? When an AI assistant suggests an import as part of a larger code block, that moment often disappears. The developer is focused on the functionality, not the dependency.
This effect compounds across teams and time. The dependencies AI assistants choose aren’t random; they reflect training data. Popular libraries appear more frequently in training data and are therefore suggested more frequently. When vulnerabilities are discovered in these popular libraries, the blast radius is significant precisely because both human developers and AI assistants have gravitated toward the same widely adopted solutions.
Shadow AI
Not all AI coding assistant usage is sanctioned. Table 22 reveals a “shadow AI”—developers using AI tools without organizational approval, visibility, or governance.
| Shadow AI indicator | Source | Finding |
|---|---|---|
| Using AI without permission | DevSecOps survey | 11% |
| Using AI against policy | Embedded Software report | 18% |
| Organizations aware of unsanctioned use | Embedded Software report | 18% |
Eleven percent of DevSecOps professionals admit to using AI coding assistants in an “unverified/unmonitored” way without official permission. This figure likely understates the reality—respondents may underreport behavior they know violates policy.
Black Duck’s “State of Embedded Software Quality and Safety” report found an even higher rate: 18% of organizations know that developers are using AI tools even when organizational policy prohibits it.
Shadow AI creates risks that organizations cannot manage because they cannot see them: unknown code provenance, potential license contamination, security oversights, compliance failures in regulated industries, and IP exposure when proprietary code is transmitted to cloud services for processing.
Why Shadow AI Happens
- Productivity pressure. Developers face relentless pressure to ship features. AI assistants accelerate development. When policy prohibits tools that make developers faster, some developers will use them anyway.
- Perceived low risk. Many developers view AI assistants as “just fancy autocomplete”—helpful but not fundamentally different from other IDE features.
- Inadequate alternatives. Organizations that ban AI assistants without providing alternative productivity tools leave developers to choose between policy compliance and getting their work done.
- Inconsistent enforcement. Policies that exist on paper but aren’t technically enforced become suggestions rather than requirements.
Development Velocity Shown in the OSSRA Data
The OSSRA data shows acceleration across every metric we track. While we cannot attribute these trends to any single cause, the patterns are dramatic.
Acceleration Across Every Metric
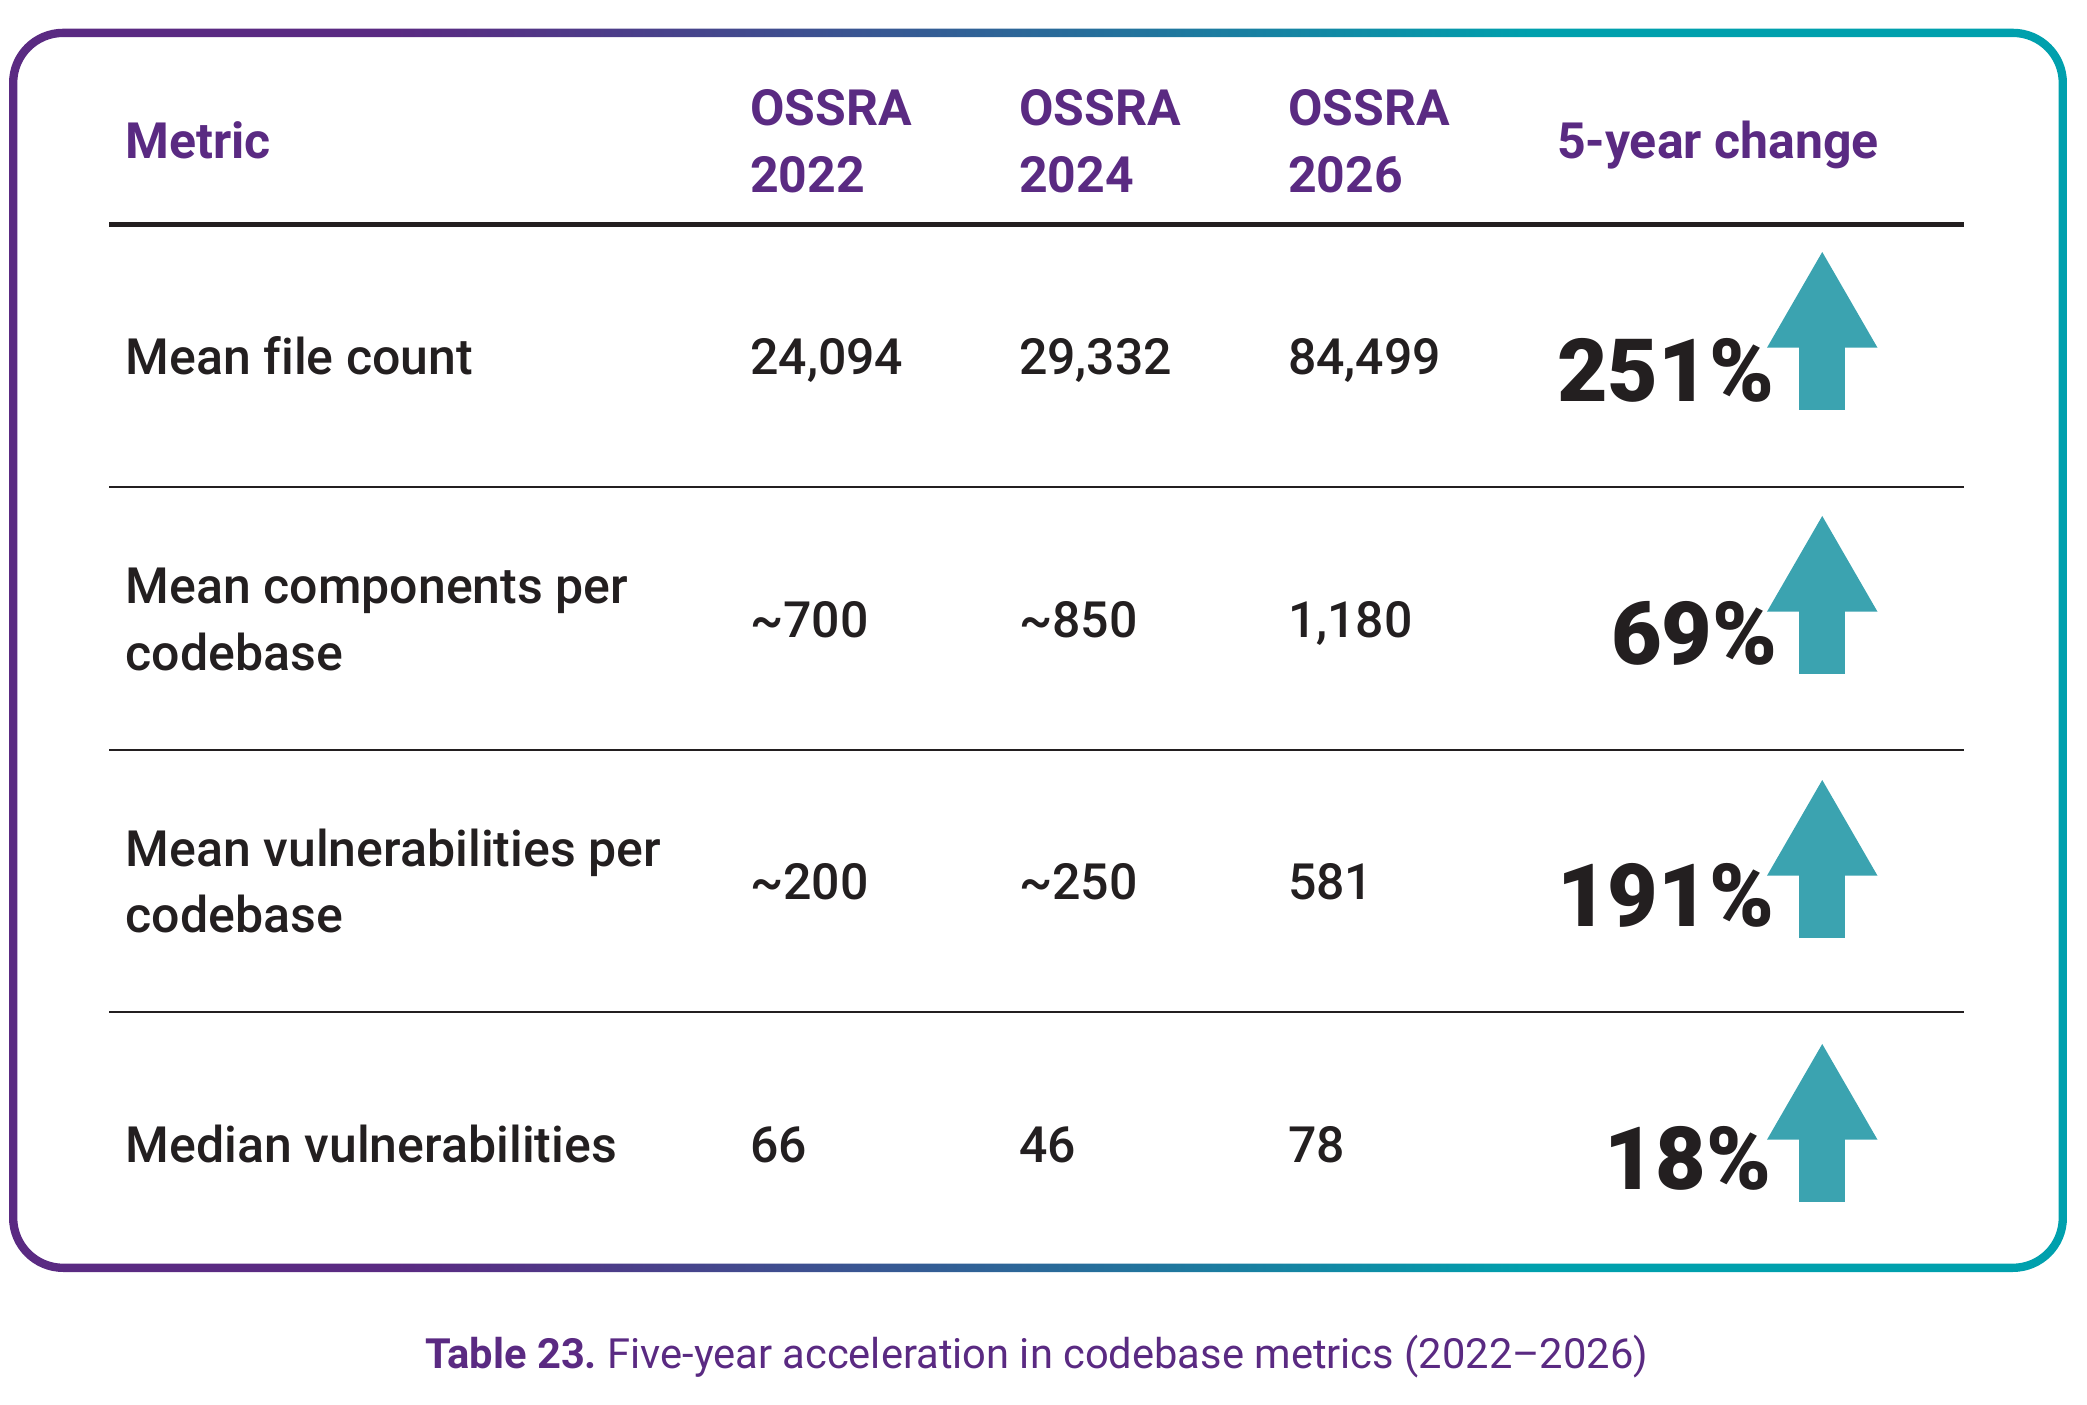
View underlying data — Table 23. Five-year acceleration in codebase metrics (2022–2026)
| Metric | OSSRA 2022 | OSSRA 2024 | OSSRA 2026 | 5-year change |
|---|---|---|---|---|
| Mean file count | 24,094 | 29,332 | 84,499 | 251% |
| Mean components per codebase | ~700 | ~850 | 1,180 | 69% |
| Mean vulnerabilities per codebase | ~200 | ~250 | 581 | 191% |
| Median vulnerabilities | 66 | 46 | 78 | 18% |
From 2021 to 2023, growth was steady but manageable—single-digit or low double-digit percentage increases. Beginning in 2024, every metric accelerated dramatically.
- File counts increased 65% from the 2023 to 2024 OSSRA, then another 74% from 2024 to 2025
- Vulnerabilities per codebase increased 107% in a single year
- Component counts increased 29.5% year-over-year
This timing coincides with mainstream AI coding assistant adoption. GitHub Copilot reached general availability in June 2022; by late 2023, it and its competitors had become standard tools for millions of developers.
However, correlation is not causation. Multiple factors are at play, and the codebases in our M&A audit data weren’t built in a year—they represent years of accumulated development decisions. AI-assisted development may be accelerating existing patterns, but it’s one factor among several, including disclosure acceleration (notably the Linux Kernel CNA change), microservices architectures, and the continued growth of open source ecosystems.
The Path Forward
The challenges outlined in this section are not caused by AI coding tools themselves, but by the scale and velocity they enable. Just as open source transformed software development—and is now a permanent fixture in how software is built—AI-assisted coding is here to stay.
The organizations that navigate this transition successfully will be those that:
- Establish clear AI governance rather than prohibition (which drives usage underground)
- Integrate security into AI-assisted workflows rather than treating AI-generated code as a separate category
- Maintain visibility into what tools developers are using and what code they’re producing
- Invest in comprehensive evaluation of AI-generated code across security, license, and quality dimensions
The data in this report provides the context for understanding these challenges. The following section discusses how Black Duck’s portfolio of solutions helps organizations address them.
Conclusion and Recommendations: Addressing Open Source Risk
What the Data Tells Us
The findings in this report document a software landscape that has fundamentally changed. Mean open source components per codebase have grown to 1,180. Mean vulnerabilities have more than doubled to 581. License conflicts have reached their highest levels in OSSRA history. And more than 90% of codebases carry significant maintenance debt.
These trends reflect the new reality of software development. AI-assisted coding has accelerated the pace at which code is written and dependencies are added. Open source has become effectively universal—98% of the audited codebases contain open source components. And the complexity of modern applications continues to grow, with file counts quadrupling over five years.
This is the environment organizations must navigate. The question is whether organizations have the visibility, intelligence, and processes to manage open source risk at this scale.
What Organizations Need
The data in this report points to several capabilities that organizations need to address the changing software security environment.
- Depth of analysis. Our audits found that 16% of open source components entered codebases outside of standard package management—vendor dependencies copied into repositories, code snippets from Stack Overflow or AI assistants, and binary components without source. Tools that rely solely on manifest scanning miss this code entirely.
- Intelligence beyond CVEs. Black Duck Security Advisories provide earlier and deeper analysis of open source risks, including issues that never receive a CVE. Black Duck independently researches and validates open source vulnerabilities and offers richer technical context for remediation. BDSAs include accurate vulnerable version ranges, patch information, and fixed versions, giving development and security teams precise guidance on what’s impacted and how to resolve vulnerabilities quickly.
- License visibility. With 68% of codebases containing license conflicts—and the combinatorial complexity of 1,180 components creating over 695,000 potential pairings—organizations need automated detection that goes beyond declared dependencies to identify conflicts in transitive dependencies and AI-generated code.
- Operational awareness. When 93% of codebases contain components with no development activity in over two years, organizations need visibility into component age, maintenance status, and upstream viability—before a vulnerability is discovered in an abandoned project with no upstream fix.
- Workflow integration. With 44% of developers using AI coding assistants frequently or constantly, security analysis must integrate into the environments where developers work—IDEs, pull requests, and CI/CD pipelines.
- AI model risk insights. Organizations need to identify and analyze open source AI models, including their usage, licensing, and data origins within a codebase. This capability helps manage the increasing complexity of AI models in software development and integrate them into SBOMs for compliance transparency.
The Black Duck Application Security Portfolio
Black Duck’s application security solutions are specifically built to address these requirements.
Black Duck SCA
Black Duck® SCA provides deep open source analysis through multiple detection methods—dependency analysis, snippet matching, binary analysis, AI model identification, and CodePrint matching against the Black Duck KnowledgeBase. This multimethod approach identifies the open source that manifest-only scanning misses.
Black Duck SCA delivers:
- Comprehensive vulnerability detection through Black Duck Security Advisories, including coverage for vulnerabilities with no CVE equivalent and corrected CVSS scores where NVD assessments are inaccurate
- License compliance analysis that identifies conflicts across complex dependency trees, including custom and modified licenses that require legal review
- Remediation guidance that provides actionable fix recommendations, not just findings
- Obsolescence information with insight into component age, maintenance status, and version currency
In late 2025, Black Duck rolled out AI model scanning for Black Duck SCA.
- Models identified anywhere. Our signature-based scanning detects AI/ML models even if they’re deliberately obscured or not listed in your build manifest. No more guessing what’s in your codebase.
- License clarity. Black Duck SCA identifies model licenses to keep you compliant, whether it’s open source or commercial software, saving you from costly legal surprises.
- Deep insights made simple. A dedicated UI screen serves up model-specific metadata showing what the model is good at (e.g., code completion) and details on datasets. This helps teams build usage policies like “no retrained foundational models” with ease.
- Seamless integration. AI model scanning plugs right into your existing Black Duck workflows, leveraging our SBOM engine for a unified SCA experience.
- Supply chain transparency. Any model identified or manually added to a project can be included in an SBOM to satisfy customer and industry requirements.
This early version of AI model scanning for Black Duck SCA is focused on identification and licensing, but it’s built to scale. Future updates will bring deeper insights into security and operational risks introduced by models, and more customized policy configuration.
Polaris Platform
Black Duck Polaris™ Platform unifies SAST, SCA, and DAST capabilities with intelligent prioritization across finding types. Polaris enables organizations to:
- Consolidate tooling rather than managing separate scanners with redundant and conflicting findings
- Prioritize effectively across vulnerability types based on severity, exploitability, and business context
- Integrate with developer workflows through IDE plug-ins and CI/CD pipeline integration and SCM integrations
Black Duck Assist
Black Duck Assist™ provides AI-powered guidance within existing tools, helping developers understand findings and act on them efficiently. Assist accelerates the path from finding to fix by providing contextual remediation advice.
The KnowledgeBase Foundation
What enables these capabilities is the Black Duck KnowledgeBase—the most comprehensive repository of open source intelligence available.
- 3.2 petabytes of open source software metadata and archives
- 10+ million open source projects from 58,000+ data sources
- 317,000 known vulnerabilities and 63,000 Black Duck Security Advisories
- 3,000 licenses tracked
- 20+ years of continuous curation by security experts
This foundation is what distinguishes Black Duck’s analysis from tools that rely on surface-level scanning or AI-only approaches. The KnowledgeBase provides ground truth—accurate and actionable vulnerability data, accurate severity assessments, confirmed remediation paths, and comprehensive license intelligence. This depth is what enables findings you can act on with confidence.
| Solution | Strength | Best for |
|---|---|---|
| Black Duck SCA | Deep open source analysis, vulnerability risk management, BDSAs data, license compliance, SBOM generation | Comprehensive OSS and supply chain risk management, M&A due diligence, compliance |
| Polaris | Unified SAST/SCA/DAST platform, intelligent prioritization, developer-first workflows | Organizations wanting a unified SaaS platform with developer-first workflows and intelligent prioritization |
| Black Duck Assist | AI-powered guidance within existing tools | Helping developers understand and act on findings |
Introducing Signal: An Evolutionary Addition to the Black Duck Portfolio
Black Duck Signal™ represents the next step in Black Duck’s application security evolution—extending the portfolio with AI-native capabilities while building on the KnowledgeBase foundation that makes accurate analysis possible.
Signal is designed to augment your existing AST capabilities, not replace them. Where Black Duck SCA provides deep, precise analysis of open source components with accurate and actionable vulnerability data, Signal will extend coverage to first-party code and languages where traditional tooling has gaps. Signal will plug directly into your AI-coding assistants for fast feedback. Where Polaris provides intelligent prioritization across finding types, Signal will add contextual analysis to help determine which findings represent genuine risk in a specific environment.
Planned Capabilities
Contextual analysis. Signal is designed to go beyond reachability to provide contextual risk assessment. Reachability answers whether vulnerable code can be reached; contextual analysis will consider the application’s architecture, inputs, and controls to help assess actual risk profile.
Fix suggestions. Signal will generate fix suggestions tailored to specific codebases—not generic patches, but implementations that fit existing coding patterns and architectural approaches. Fix generation will leverage KnowledgeBase remediation patterns combined with AI code understanding.
Extended language coverage. Traditional AST tools require language-specific parsers and rules. Signal’s AI-powered analysis is designed to extend coverage across languages without requiring language-specific tooling—complementing the deep analysis that language-specific tools provide while covering gaps in legacy languages, emerging frameworks, and code that traditional parsers don’t yet support.
AI workflow integration. Signal is being designed to operate within AI coding assistant environments—GitHub Copilot, Cursor, Claude Code, Windsurf, and others—providing security feedback where developers increasingly work.
Built on the KnowledgeBase
What will distinguish Signal from other AI-powered security tools is its foundation. Signal will augment LLM capabilities with KnowledgeBase intelligence—combining AI pattern recognition with human-vetted ground truth. The result is designed to be analysis that is both intelligent and accurate: capable of identifying novel issues while grounded in accurate and actionable vulnerability data, confirmed remediation patterns, and comprehensive license intelligence.
Signal is not a replacement for proven approaches—it’s an extension of them. Organizations will benefit from combining the deep analysis of Black Duck SCA and Polaris with Signal’s AI-native capabilities, applying each where it delivers the most value.
Getting Started
The challenges documented in this report—growing vulnerability counts, increasing license complexity, accumulating maintenance debt, and the accelerating pace of AI-assisted development—are addressable with the right combination of tools, processes, and intelligence.
For organizations addressing these challenges today: Black Duck SCA, Polaris, and Assist are available now. These solutions provide the depth of analysis, breadth of coverage, and workflow integration that modern software development requires. Contact your Black Duck representative to discuss how these capabilities align with your security objectives.
For organizations interested in Signal: The Signal Early Access Program provides access to Signal’s capabilities as they become available, along with onboarding support and direct feedback channels to the product team. The program is designed for organizations that want to extend their existing Black Duck deployment with AI-native capabilities and help shape the product’s development. To learn more, contact your Black Duck representative or visit blackduck.com/signal.
About Black Duck
Black Duck® meets the board-level risks of modern software with True Scale Application Security, ensuring uncompromised trust in software for the regulated, AI-powered world. Only Black Duck solutions free organizations from tradeoffs between speed, accuracy, and compliance at scale while eliminating security, regulatory, and licensing risks. Whether in the cloud or on premises, Black Duck is the only choice for securing mission-critical software everywhere code happens. With Black Duck, security leaders can make smarter decisions and unleash business innovation with confidence. Learn more at www.blackduck.com.